2001 CHICAGO, O'HARE INTERNATIONAL AIRPORT, ILLINOIS (ORD)
Chicago is located along the southwest shore of Lake Michigan and occupies a plain which, for the most part, is only some tens of feet above the lake. Lake Michigan averages 579 feet above sea level. Natural water drainage over most of the city would be into Lake Michigan, and from areas west of the city is into the Mississippi River System. But actual drainage over most of the city is artificially channeled also into the Mississippi system. Topography does not significantly affect air flow in or near the city except that lesser frictional drag over Lake Michigan causes winds to be frequently stronger along the lakeshore, and often permits air masses moving from the north to reach shore areas an hour or more before affecting western parts of the city.
Chicago is in a region of frequently changeable weather. The climate is predominately continental, ranging from relatively warm in summer to relatively cold in winter. However, the continentality is partially modified by Lake Michigan, and to a lesser extent by other Great Lakes. In late autumn and winter, air masses that are initially very cold often reach the city only after being tempered by passage over one or more of the lakes. Similarly, in late spring and summer, air masses reaching the city from the north, northeast, or east are cooler because of movement over the Great Lakes. Very low winter temperatures most often occur in air that flows southward to the west of Lake Superior before reaching the Chicago area. In summer the higher temperatures are with south or southwest flow and are therefore not influenced by the lakes, the only modifying effect being a local lake breeze. Strong south or southwest flow may overcome the lake breeze and cause high temperatures to extend over the entire city.
During the warm season, when the lake is cold relative to land, there is frequently a lake breeze that reduces daytime temperature near the shore, sometimes by 10 degrees or more below temperatures farther inland. When the breeze off the lake is light this effect usually reaches inland only a mile or two, but with stronger on–shore winds the whole city is cooled. On the other hand, temperatures at night are warmer near the lake so that 24–hour averages on the whole are only slightly different in various parts of the city and suburbs.
At the O'Hare International Airport temperatures of 96 degrees or higher occur in about half the summers, while about half the winters have a minimum as low as −15 degrees. The average occurrence of the first temperature as low as 32 degrees in the fall is mid–October and the average occurrence of the last temperature as low as 32 degrees in the spring is late April.
Precipitation falls mostly from air that has passed over the Gulf of Mexico. But in winter there is sometimes snowfall, light inland but locally heavy near the lakeshore, with Lake Michigan as the principal moisture source. The heavy lakeshore snow occurs when initially colder air moves from the north with a long trajectory over Lake Michigan and impinges on the Chicago lakeshore. In this situation the air mass is warmed and its moisture content increased up to a height of several thousand feet. Snowfall is produced by upward currents that become stronger, because of frictional effects, when the air moves from the lake onto land. This type of snowfall therefore tends to be heavier and to extend farther inland in south–shore areas of the city and in Indiana suburbs, where the angle between wind–flow and shoreline is greatest. The effect of Lake Michigan, both on winter temperatures and lake–produced snowfall, is enhanced by non–freezing of much of the lake during the winter, even though areas and harbors are often ice–choked.
Summer thunderstorms are often locally heavy and variable, parts of the city may receive substantial rainfall and other parts none. Longer periods of continuous precipitation are mostly in autumn, winter, and spring. About one–half the precipitation in winter, and about 10 percent of the yearly total precipitation, falls as snow. Snowfall from month to month and year to year is greatly variable. There is a 50 percent likelihood that the first and last l–inch snowfall of a season will occur by December 5 and March 20, respectively.
Channeling of winds between tall buildings often causes locally stronger gusts in the central business area. However, the nickname, windy city, is a misnomer as the average wind speed is not greater than in many other parts of the U.S.
NORMALS, MEANS, AND EXTREMES
CHICAGO, IL (ORD)
LATITUDE: LONGITUDE: ELEVATION (FT): TIME ZONE: WBAN: 94846
41 59′ 10″ N 87 54′ 51″ W GRND: 655 BARO: 658 CENTRAL (UTC + 6)

| ELEMENT | POR | JAN | FEB | MAR | APR | MAY | JUN | JUL | AUG | SEP | OCT | NOV | DEC | YEAR | |
| TEMPERATURE F | NORMAL DAILY MAXIMUM | 30 | 29.0 | 33.5 | 45.8 | 58.6 | 70.1 | 79.6 | 83.7 | 81.8 | 74.8 | 63.3 | 48.4 | 34.0 | 58.5 |
| MEAN DAILY MAXIMUM | 43 | 29.5 | 34.3 | 45.4 | 58.4 | 70.1 | 79.5 | 83.6 | 81.9 | 74.7 | 63.0 | 48.0 | 34.7 | 58.6 | |
| HIGHEST DAILY MAXIMUM | 43 | 65 | 72 | 88 | 91 | 93 | 104 | 104 | 101 | 99 | 91 | 78 | 71 | 104 | |
| YEAR OF OCCURRENCE | 1989 | 2000 | 1986 | 1980 | 1977 | 1988 | 1995 | 1991 | 1985 | 1963 | 1978 | 1982 | JUL 1995 | ||
| MEAN OF EXTREME MAXS. | 43 | 49.5 | 54.5 | 72.0 | 80.5 | 87.5 | 93.0 | 95.0 | 92.9 | 89.9 | 81.7 | 68.1 | 55.9 | 76.7 | |
| NORMAL DAILY MINIMUM | 30 | 12.9 | 17.2 | 28.5 | 38.6 | 47.7 | 57.5 | 62.6 | 61.6 | 53.9 | 42.2 | 31.6 | 19.1 | 39.5 | |
| MEAN DAILY MINIMUM | 43 | 14.0 | 18.7 | 28.0 | 38.6 | 48.2 | 57.4 | 62.9 | 62.1 | 53.9 | 42.4 | 31.8 | 20.1 | 39.8 | |
| LOWEST DAILY MINIMUM | 43 | -27 | -19 | -8 | 7 | 24 | 36 | 40 | 41 | 28 | 17 | 1 | -25 | -27 | |
| YEAR OF OCCURRENCE | 1985 | 1996 | 1962 | 1982 | 1966 | 1972 | 1965 | 1965 | 1974 | 1981 | 1976 | 1983 | JAN 1985 | ||
| MEAN OF EXTREME MINS. | 43 | -9.0 | -2.9 | 10.0 | 23.1 | 34.1 | 43.5 | 50.2 | 50.8 | 38.6 | 27.2 | 15.3 | -1.9 | 23.2 | |
| NORMAL DRY BULB | 30 | 21.0 | 25.4 | 37.2 | 48.6 | 58.9 | 68.6 | 73.2 | 71.7 | 64.4 | 52.8 | 40.0 | 26.6 | 49.0 | |
| MEAN DRY BULB | 43 | 21.7 | 26.5 | 36.8 | 48.4 | 59.2 | 68.5 | 73.2 | 71.9 | 64.3 | 52.8 | 39.7 | 27.4 | 49.2 | |
| MEAN WET BULB | 18 | 22.5 | 26.2 | 34.0 | 43.0 | 53.3 | 62.1 | 66.7 | 65.9 | 58.3 | 47.7 | 34.8 | 26.6 | 45.1 | |
| MEAN DEW POINT | 18 | 17.8 | 21.0 | 27.9 | 36.2 | 47.2 | 57.0 | 62.3 | 61.9 | 53.5 | 42.3 | 30.0 | 21.8 | 39.9 | |
| NORMAL NO. DAYS WITH: | |||||||||||||||
| MAXIMUM 90 | 30 | 0.0 | 0.0 | 0.0 | * | 0.8 | 3.8 | 6.7 | 4.2 | 1.5 | 0.1 | 0.0 | 0.0 | 17.1 | |
| MAXIMUM 32 | 30 | 17.6 | 12.7 | 3.9 | 0.1 | 0.0 | 0.0 | 0.0 | 0.0 | 0.0 | 0.0 | 1.7 | 11.9 | 47.9 | |
| MINIMUM 32 | 30 | 28.7 | 25.0 | 21.0 | 7.8 | 0.9 | 0.0 | 0.0 | 0.0 | 0.2 | 5.3 | 16.5 | 26.7 | 132.1 | |
| MINIMUM 0 | 30 | 7.0 | 3.2 | 0.2 | 0.0 | 0.0 | 0.0 | 0.0 | 0.0 | 0.0 | 0.0 | 0.0 | 2.9 | 13.3 | |
| H/C | NORMAL HEATING DEG. DAYS | 30 | 1364 | 1109 | 862 | 492 | 235 | 35 | 5 | 19 | 84 | 391 | 750 | 1190 | 6536 |
| NORMAL COOLING DEG. DAYS | 30 | 0 | 0 | 0 | 0 | 46 | 143 | 259 | 226 | 66 | 12 | 0 | 0 | 752 | |
| RH | NORMAL (PERCENT) | 30 | 72 | 72 | 70 | 65 | 64 | 66 | 68 | 71 | 71 | 69 | 72 | 76 | 70 |
| HOUR 00 LST | 30 | 75 | 76 | 76 | 72 | 73 | 75 | 79 | 81 | 81 | 76 | 77 | 78 | 77 | |
| HOUR 06 LST | 30 | 76 | 77 | 79 | 77 | 77 | 78 | 82 | 85 | 85 | 81 | 80 | 80 | 80 | |
| HOUR 12 LST | 30 | 67 | 65 | 61 | 55 | 53 | 55 | 57 | 57 | 57 | 55 | 64 | 70 | 60 | |
| HOUR 18 LST | 30 | 71 | 69 | 64 | 57 | 54 | 55 | 58 | 61 | 63 | 64 | 70 | 74 | 63 | |
| S | PERCENT POSSIBLE SUNSHINE | 16 | 44 | 49 | 51 | 50 | 58 | 67 | 66 | 62 | 59 | 55 | 38 | 43 | 54 |
| W/O | MEAN NO. DAYS WITH: | ||||||||||||||
| HEAVY FOG (VISBY 1/4 MI) | 44 | 1.7 | 1.8 | 2.2 | 0.9 | 1.2 | 0.6 | 0.5 | 0.7 | 0.4 | 0.8 | 1.3 | 1.9 | 14.0 | |
| THUNDERSTORMS | 44 | 0.3 | 0.5 | 2.0 | 4.0 | 5.1 | 6.6 | 5.9 | 6.0 | 4.2 | 1.7 | 1.1 | 0.6 | 38.0 | |
| CLOUDINESS | MEAN: | ||||||||||||||
| SUNRISE-SUNSET (OKTAS) | 38 | 5.5 | 5.4 | 5.8 | 5.5 | 5.0 | 4.7 | 4.4 | 4.4 | 4.5 | 4.7 | 5.7 | 5.6 | 5.1 | |
| MIDNIGHT-MIDNIGHT (OKTAS) | 32 | 5.3 | 5.0 | 5.1 | 5.0 | 4.5 | 4.3 | 4.0 | 4.0 | 4.2 | 4.3 | 5.4 | 5.5 | 4.7 | |
| MEAN NO. DAYS WITH: | |||||||||||||||
| CLEAR | 39 | 6.8 | 6.0 | 4.9 | 6.0 | 7.2 | 7.3 | 8.0 | 8.6 | 8.5 | 8.6 | 5.2 | 5.7 | 82.8 | |
| PARTLY CLOUDY | 39 | 6.2 | 6.5 | 8.5 | 7.6 | 9.9 | 11.5 | 12.1 | 11.2 | 9.5 | 8.5 | 6.2 | 5.9 | 103.6 | |
| CLOUDY | 39 | 18.0 | 15.7 | 17.6 | 16.4 | 13.9 | 11.2 | 10.1 | 10.4 | 11.2 | 13.3 | 17.7 | 18.5 | 174.0 | |
| PR | MEAN STATION PRESSURE (IN) | 29 | 29.30 | 29.30 | 29.30 | 29.20 | 29.20 | 29.20 | 29.30 | 29.30 | 29.30 | 29.31 | 29.31 | 29.31 | 29.28 |
| MEAN SEA-LEVEL PRES. (IN) | 18 | 30.10 | 30.10 | 30.06 | 29.96 | 29.97 | 30.01 | 30.00 | 30.04 | 30.06 | 30.08 | 30.06 | 30.11 | 30.05 | |
| WINDS | MEAN SPEED (MPH) | 38 | 11.6 | 11.4 | 11.9 | 12.0 | 10.5 | 9.4 | 8.6 | 8.4 | 9.0 | 10.2 | 11.1 | 11.0 | 10.4 |
| PREVAIL. DIR (TENS OF DEGS) | 33 | 27 | 29 | 29 | 04 | 04 | 21 | 23 | 23 | 18 | 19 | 21 | 27 | 21 | |
| MAXIMUM 2-MINUTE: | |||||||||||||||
| SPEED (MPH) | 5 | 37 | 38 | 41 | 43 | 37 | 39 | 37 | 41 | 37 | 43 | 41 | 32 | 43 | |
| DIR. (TENS OF DEGS) | 09 | 26 | 02 | 26 | 28 | 30 | 01 | 24 | 28 | 07 | 23 | 33 | 07 | ||
| YEAR OF OCCURRENCE | 1999 | 2001 | 1998 | 1997 | 1998 | 1998 | 1997 | 2000 | 1997 | 1997 | 1998 | 2000 | OCT 1997 | ||
| MAXIMUM 5-SECOND: | |||||||||||||||
| SPEED (MPH) | 5 | 47 | 56 | 47 | 56 | 54 | 48 | 61 | 59 | 48 | 52 | 57 | 41 | 61 | |
| DIR. (TENS OF DEGS) | 09 | 24 | 02 | 25 | 27 | 30 | 20 | 25 | 21 | 07 | 24 | 27 | 20 | ||
| YEAR OF OCCURRENCE | 1999 | 1999 | 1998 | 1997 | 1998 | 1998 | 1999 | 2000 | 2001 | 1997 | 1998 | 2001 | JUL 1999 | ||
| PRECIPITATION | NORMAL (IN) | 30 | 1.53 | 1.36 | 2.69 | 3.64 | 3.32 | 3.78 | 3.66 | 4.22 | 3.82 | 2.41 | 2.92 | 2.47 | 35.82 |
| MAXIMUM MONTHLY (IN) | 43 | 4.47 | 5.56 | 5.91 | 7.69 | 7.14 | 9.96 | 8.33 | 17.10 | 11.44 | 8.54 | 8.22 | 8.56 | 17.10 | |
| YEAR OF OCCURRENCE | 1999 | 1997 | 1976 | 1983 | 1970 | 1993 | 1982 | 1987 | 1961 | 2001 | 1985 | 1982 | AUG 1987 | ||
| MINIMUM MONTHLY (IN) | 43 | 0.10 | 0.12 | 0.63 | 0.97 | 0.30 | 0.95 | 1.18 | 0.51 | 0.02 | 0.16 | 0.44 | 0.23 | 0.02 | |
| YEAR OF OCCURRENCE | 1981 | 1969 | 1981 | 1971 | 1992 | 1991 | 1977 | 1969 | 1979 | 1964 | 1999 | 1962 | SEP 1979 | ||
| MAXIMUM IN 24 HOURS (IN) | 43 | 2.00 | 3.78 | 2.39 | 2.78 | 3.45 | 3.79 | 2.90 | 9.35 | 3.00 | 4.62 | 2.99 | 4.53 | 9.35 | |
| YEAR OF OCCURRENCE | 1960 | 1997 | 1985 | 1983 | 1981 | 1994 | 1993 | 1987 | 1978 | 1969 | 1990 | 1982 | AUG 1987 | ||
| NORMAL NO. DAYS WITH: | |||||||||||||||
| PRECIPITATION 0.01 | 30 | 11.1 | 9.4 | 12.4 | 12.6 | 10.9 | 10.1 | 9.8 | 9.5 | 9.5 | 9.2 | 10.9 | 11.6 | 127.0 | |
| PRECIPITATION 1.00 | 30 | 0.2 | 0.1 | 0.4 | 0.7 | 0.5 | 0.9 | 1.0 | 1.2 | 1.1 | 0.3 | 0.5 | 0.5 | 7.4 | |
| SNOWFALL | NORMAL (IN) | 30 | 10.7 | 8.4 | 6.5 | 1.8 | 0.1 | 0.0 | 0.0 | 0.0 | 0.0 | 0.5 | 1.9 | 8.8 | 38.7 |
| MAXIMUM MONTHLY (IN) | 42 | 34.3 | 26.2 | 24.7 | 11.1 | 1.6 | T | T | T | T | 6.6 | 10.4 | 35.3 | 35.3 | |
| YEAR OF OCCURRENCE | 1979 | 1994 | 1965 | 1975 | 1966 | 1992 | 1995 | 1989 | 1967 | 1967 | 1959 | 1978 | DEC 1978 | ||
| MAXIMUM IN 24 HOURS (IN) | 42 | 18.6 | 11.1 | 10.6 | 10.9 | 1.6 | T | T | T | T | 6.6 | 5.8 | 11.0 | 18.6 | |
| YEAR OF OCCURRENCE | 1999 | 2000 | 1970 | 1975 | 1966 | 1992 | 1995 | 1989 | 1967 | 1967 | 1975 | 1969 | JAN 1999 | ||
| MAXIMUM SNOW DEPTH (IN) | 41 | 28 | 27 | 20 | 11 | 1 | 0 | 0 | 0 | 0 | 3 | 6 | 17 | 28 | |
| YEAR OF OCCURRENCE | 1979 | 1967 | 1965 | 1975 | 1966 | 1989 | 1975 | 2000 | JAN 1979 | ||||||
| NORMAL NO. DAYS WITH: | |||||||||||||||
| SNOWFALL 1.0 | 30 | 3.3 | 2.7 | 2.0 | 0.4 | 0.* | 0.0 | 0.0 | 0.0 | 0.0 | 0.2 | 0.6 | 2.6 | 11.8 |
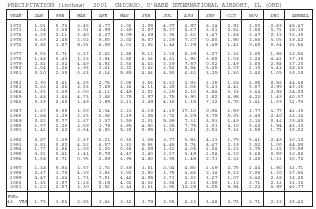
| PRECIPITATION (inches) 2001 CHICAGO, O'HARE INTERNATIONAL AIRPORT, IL (ORD) | |||||||||||||
| YEAR | JAN | FEB | MAR | APR | MAY | JUN | JUL | AUG | SEP | OCT | NOV | DEC | ANNUAL |
| 1972 | 1.01 | 0.73 | 3.45 | 4.77 | 3.02 | 3.55 | 4.97 | 6.97 | 8.14 | 2.92 | 3.05 | 2.89 | 45.47 |
| 1973 | 1.24 | 1.38 | 3.91 | 4.99 | 3.69 | 2.87 | 5.27 | 0.67 | 6.01 | 2.86 | 1.50 | 3.71 | 38.10 |
| 1974 | 3.29 | 2.11 | 2.40 | 4.27 | 5.09 | 4.69 | 2.96 | 2.60 | 1.47 | 1.88 | 2.47 | 2.12 | 35.35 |
| 1975 | 3.69 | 2.48 | 2.02 | 5.50 | 3.02 | 5.07 | 2.19 | 7.37 | 0.80 | 1.90 | 2.53 | 3.05 | 39.62 |
| 1976 | 0.85 | 1.87 | 5.91 | 4.05 | 4.03 | 2.93 | 1.44 | 1.29 | 1.49 | 1.41 | 0.65 | 0.64 | 26.56 |
| 1977 | 0.55 | 0.71 | 3.67 | 2.62 | 1.88 | 5.12 | 1.18 | 5.39 | 6.07 | 1.36 | 2.05 | 1.96 | 32.56 |
| 1978 | 1.48 | 0.43 | 1.16 | 3.94 | 2.80 | 6.36 | 4.61 | 1.96 | 6.88 | 1.08 | 2.24 | 4.41 | 37.35 |
| 1979 | 2.81 | 1.02 | 4.49 | 4.92 | 2.58 | 4.63 | 2.19 | 7.57 | 0.02 | 1.49 | 2.80 | 2.58 | 37.10 |
| 1980 | 1.04 | 1.24 | 1.96 | 3.41 | 3.22 | 3.42 | 3.56 | 8.54 | 5.65 | 2.09 | 1.10 | 3.43 | 38.66 |
| 1981 | 0.10 | 2.35 | 0.63 | 6.14 | 5.85 | 4.46 | 4.50 | 6.60 | 3.25 | 1.80 | 2.46 | 1.05 | 39.19 |
| 1982 | 2.90 | 0.41 | 4.15 | 2.78 | 2.08 | 1.56 | 8.33 | 3.93 | 1.15 | 1.88 | 6.95 | 8.56 | 44.68 |
| 1983 | 0.66 | 2.06 | 3.56 | 7.69 | 6.26 | 4.11 | 4.25 | 2.08 | 5.41 | 4.41 | 5.87 | 2.99 | 49.35 |
| 1984 | 1.15 | 1.39 | 3.00 | 4.11 | 4.49 | 2.02 | 3.19 | 2.10 | 3.84 | 3.15 | 2.64 | 2.92 | 34.00 |
| 1985 | 1.48 | 3.46 | 4.73 | 1.48 | 2.79 | 1.97 | 3.75 | 3.90 | 1.82 | 4.98 | 8.22 | 1.49 | 40.07 |
| 1986 | 0.39 | 2.58 | 1.49 | 1.85 | 3.11 | 3.49 | 4.30 | 1.15 | 7.12 | 3.75 | 1.41 | 1.09 | 31.73 |
| 1987 | 1.67 | 0.99 | 1.59 | 2.34 | 2.21 | 2.19 | 4.19 | 17.10 | 0.94 | 1.59 | 2.77 | 3.77 | 41.35 |
| 1988 | 1.88 | 1.29 | 2.15 | 2.08 | 1.19 | 1.05 | 2.74 | 3.29 | 3.79 | 5.05 | 6.45 | 2.40 | 33.36 |
| 1989 | 0.82 | 0.77 | 1.67 | 1.37 | 1.59 | 2.01 | 5.89 | 7.31 | 3.91 | 1.49 | 2.16 | 0.46 | 29.45 |
| 1990 | 1.97 | 2.25 | 3.09 | 1.79 | 6.85 | 4.50 | 2.25 | 7.75 | 1.03 | 4.10 | 5.60 | 1.94 | 43.12 |
| 1991 | 1.41 | 0.62 | 3.54 | 4.00 | 5.20 | 0.95 | 1.32 | 2.81 | 2.51 | 7.36 | 3.59 | 1.71 | 35.02 |
| 1992 | 0.87 | 1.39 | 2.67 | 2.21 | 0.30 | 1.35 | 3.77 | 3.56 | 4.31 | 1.79 | 5.41 | 2.49 | 30.12 |
| 1993 | 3.83 | 0.82 | 4.52 | 4.57 | 1.83 | 9.96 | 4.45 | 5.74 | 4.47 | 2.19 | 1.52 | 1.00 | 44.90 |
| 1994 | 1.77 | 2.56 | 1.09 | 2.20 | 0.58 | 6.09 | 1.62 | 4.05 | 1.04 | 3.23 | 3.75 | 1.61 | 29.59 |
| 1995 | 3.21 | 0.41 | 1.43 | 5.79 | 4.47 | 1.40 | 3.17 | 3.49 | 1.04 | 4.20 | 3.68 | 0.59 | 32.88 |
| 1996 | 1.58 | 0.71 | 0.95 | 2.59 | 6.95 | 4.80 | 3.95 | 1.45 | 2.73 | 2.32 | 1.48 | 1.21 | 30.72 |
| 1997 | 1.38 | 5.56 | 1.57 | 1.76 | 2.69 | 3.81 | 3.04 | 4.50 | 1.69 | 2.75 | 1.46 | 1.50 | 31.71 |
| 1998 | 2.67 | 1.70 | 4.29 | 3.56 | 3.02 | 2.90 | 1.75 | 6.88 | 2.34 | 5.22 | 2.00 | 1.20 | 37.53 |
| 1999 | 4.47 | 1.64 | 1.73 | 7.51 | 4.46 | 4.95 | 3.73 | 2.30 | 3.27 | 1.07 | 0.44 | 2.68 | 38.25 |
| 2000 | 1.35 | 1.97 | 1.18 | 5.15 | 4.02 | 4.32 | 3.58 | 2.26 | 3.59 | 1.12 | 2.71 | 2.11 | 33.36 |
| 2001 | 1.12 | 2.57 | 1.30 | 2.82 | 3.34 | 2.61 | 2.96 | 12.25 | 6.05 | 8.54 | 1.22 | 0.99 | 45.77 |
| POR=43 YRS | 1.75 | 1.53 | 2.55 | 3.66 | 3.32 | 3.79 | 3.55 | 4.23 | 3.48 | 2.73 | 2.71 | 2.12 | 35.42 |

| AVERAGE TEMPERATURE (F) 2001 CHICAGO, O'HARE INTERNATIONAL AIRPORT, IL ( | |||||||||||||
| YEAR | JAN | FEB | MAR | APR | MAY | JUN | JUL | AUG | SEP | OCT | NOV | DEC | ANNUAL |
| 1972 | 19.6 | 23.6 | 34.0 | 44.8 | 61.0 | 65.7 | 73.6 | 73.8 | 63.5 | 49.3 | 37.7 | 23.9 | 47.5 |
| 1973 | 28.2 | 28.7 | 44.0 | 48.1 | 54.8 | 71.1 | 74.7 | 74.6 | 66.0 | 57.9 | 41.9 | 28.1 | 51.5 |
| 1974 | 24.8 | 27.4 | 38.6 | 52.3 | 56.8 | 65.5 | 73.6 | 70.0 | 60.5 | 52.8 | 40.6 | 30.2 | 49.4 |
| 1975 | 27.3 | 26.2 | 34.1 | 43.3 | 62.3 | 70.5 | 75.5 | 76.3 | 61.4 | 55.8 | 47.2 | 31.5 | 51.0 |
| 1976 | 19.9 | 35.2 | 42.8 | 52.3 | 55.9 | 70.1 | 74.0 | 70.8 | 62.7 | 48.3 | 32.4 | 19.4 | 48.7 |
| 1977 | 10.7 | 26.9 | 44.9 | 55.0 | 67.2 | 69.3 | 77.5 | 71.9 | 66.0 | 51.5 | 40.0 | 24.2 | 50.4 |
| 1978 | 15.7 | 16.8 | 31.9 | 47.5 | 58.3 | 67.6 | 72.0 | 72.4 | 68.8 | 51.4 | 40.8 | 25.8 | 47.4 |
| 1979 | 12.5 | 16.2 | 36.4 | 45.5 | 59.3 | 69.2 | 72.0 | 71.0 | 66.1 | 53.3 | 40.6 | 33.7 | 48.0 |
| 1980 | 23.4 | 21.5 | 32.6 | 46.5 | 59.7 | 65.3 | 75.7 | 75.7 | 66.0 | 48.4 | 39.9 | 28.0 | 48.6 |
| 1981 | 22.6 | 28.0 | 37.6 | 51.8 | 55.3 | 69.8 | 72.5 | 71.2 | 61.7 | 49.1 | 40.8 | 24.9 | 48.8 |
| 1982 | 12.2 | 21.5 | 35.1 | 44.5 | 64.3 | 62.1 | 74.1 | 68.8 | 62.1 | 53.2 | 39.1 | 36.0 | 47.8 |
| 1983 | 26.3 | 30.5 | 37.4 | 43.4 | 53.2 | 69.7 | 76.7 | 77.3 | 64.6 | 52.8 | 41.1 | 14.3 | 48.9 |
| 1984 | 17.1 | 33.9 | 29.5 | 45.8 | 55.5 | 70.3 | 70.3 | 72.8 | 61.1 | 54.7 | 37.9 | 31.0 | 48.3 |
| 1985 | 14.4 | 20.4 | 39.4 | 52.6 | 60.2 | 63.6 | 71.4 | 69.2 | 65.4 | 52.5 | 37.8 | 17.0 | 47.0 |
| 1986 | 22.8 | 24.0 | 40.4 | 51.5 | 59.5 | 66.3 | 74.9 | 68.5 | 66.8 | 53.7 | 36.0 | 30.6 | 49.6 |
| 1987 | 25.9 | 33.9 | 40.8 | 50.6 | 63.4 | 72.4 | 76.7 | 71.9 | 65.1 | 47.3 | 43.9 | 32.2 | 52.0 |
| 1988 | 19.8 | 22.7 | 38.1 | 48.2 | 61.0 | 71.7 | 76.8 | 76.8 | 65.9 | 46.1 | 41.7 | 27.7 | 49.7 |
| 1989 | 32.4 | 19.6 | 36.6 | 46.8 | 57.8 | 67.5 | 73.9 | 71.4 | 62.0 | 54.0 | 37.7 | 17.4 | 48.1 |
| 1990 | 33.9 | 31.3 | 41.3 | 49.9 | 56.2 | 69.6 | 71.7 | 71.9 | 65.9 | 51.6 | 44.7 | 28.6 | 51.4 |
| 1991 | 20.8 | 31.0 | 40.4 | 52.0 | 65.6 | 71.9 | 75.5 | 73.6 | 63.7 | 53.2 | 35.2 | 30.3 | 51.1 |
| 1992 | 28.1 | 33.3 | 37.5 | 46.1 | 56.9 | 64.9 | 69.3 | 67.0 | 62.7 | 50.4 | 38.3 | 28.6 | 48.6 |
| 1993 | 26.2 | 24.4 | 34.2 | 45.0 | 59.7 | 66.4 | 74.3 | 73.3 | 59.2 | 49.5 | 38.7 | 29.8 | 48.4 |
| 1994 | 15.9 | 22.1 | 38.5 | 51.1 | 58.2 | 70.2 | 73.4 | 68.7 | 66.8 | 54.7 | 44.4 | 34.8 | 49.9 |
| 1995 | 24.0 | 26.5 | 40.2 | 46.0 | 58.8 | 72.3 | 77.6 | 79.0 | 62.5 | 53.7 | 32.8 | 26.3 | 50.0 |
| 1996 | 23.4 | 26.0 | 30.8 | 45.2 | 55.0 | 68.0 | 69.9 | 72.3 | 63.5 | 51.9 | 33.4 | 27.7 | 47.3 |
| 1997 | 19.3 | 29.0 | 37.9 | 45.2 | 53.8 | 68.3 | 73.2 | 69.5 | 64.2 | 53.2 | 36.4 | 31.5 | 48.5 |
| 1998 | 29.6 | 38.7 | 39.0 | 49.8 | 64.8 | 69.3 | 74.5 | 73.5 | 67.7 | 55.5 | 44.8 | 34.7 | 53.5 |
| 1999 | 22.6 | 34.0 | 35.6 | 49.6 | 61.7 | 70.4 | 78.4 | 70.3 | 63.4 | 52.9 | 45.1 | 29.9 | 51.2 |
| 2000 | 25.3 | 34.1 | 44.2 | 47.2 | 62.0 | 67.3 | 71.1 | 72.4 | 64.7 | 56.1 | 37.0 | 16.0 | 49.8 |
| 2001 | 24.6 | 26.1 | 34.2 | 52.5 | 60.0 | 67.4 | 74.6 | 73.2 | 61.9 | 52.1 | 48.2 | 33.4 | 50.7 |
| POR=43 YRS | 21.7 | 26.5 | 36.8 | 48.5 | 59.4 | 68.5 | 73.2 | 71.8 | 64.3 | 52.8 | 39.7 | 27.3 | 49.2 |
REFERENCE NOTES:
PAGE 1:
THE TEMPERATURE GRAPH SHOWS NORMAL MAXIMUM AND NORMAL MINIMUM DAILY TEMPERATURES (SOLID CURVES) AND THE ACTUAL DAILY HIGH AND LOW TEMPERATURES (VERTICAL BARS).
PAGE 2 AND 3:
H/C INDICATES HEATING AND COOLING DEGREE DAYS.
RH INDICATES RELATIVE HUMIDITY
W/O INDICATES WEATHER AND OBSTRUCTIONS
S INDICATES SUNSHINE.
PR INDICATES PRESSURE.
CLOUDINESS ON PAGE 3 IS THE SUM OF THE CEILOMETER AND SATELLITE DATA NOT TO EXCEED EIGHT EIGHTHS (OKTAS).
GENERAL:
T INDICATES TRACE PRECIPITATION, AN AMOUNT GREATER THAN ZERO BUT LESS THAN THE LOWEST REPORTABLE VALUE.
+ INDICATES THE VALUE ALSO OCCURS ON EARLIER DATES.
BLANK ENTRIES DENOTE MISSING OR UNREPORTED DATA.
NORMALS ARE 30–YEAR AVERAGES (1961–1990).
ASOS INDICATES AUTOMATED SURFACE OBSERVING SYSTEM.
PM INDICATES THE LAST DAY OF THE PREVIOUS MONTH.
POR (PERIOD OF RECORD) BEGINS WITH THE JANUARY DATA MONTH AND IS THE NUMBER OF YEARS USED TO COMPUTE THE MEAN. INDIVIDUAL MONTHS WITHIN THE POR MAY BE MISSING.
WHEN THE POR FOR A NORMAL IS LESS THAN 30 YEARS, THE NORMAL IS PROVISIONAL AND IS BASED ON THE NUMBER OF YEARS INDICATED.
0.* OR * INDICATES THE VALUE OR MEAN–DAYS–WITH IS BETWEEN 0.00 AND 0.05.
CLOUDINESS FOR ASOS STATIONS DIFFERS FROM THE NON–ASOS OBSERVATION TAKEN BY A HUMAN OBSERVER. ASOS STATION CLOUDINESS IS BASED ON TIME–AVERAGED CEILOMETER DATA FOR CLOUDS AT OR BELOW 12,000 FEET AND ON SATELLITE DATA FOR CLOUDS ABOVE 12,000 FEET.
THE NUMBER OF DAYS WITH CLEAR, PARTLY CLOUDY, AND CLOUDY CONDITIONS FOR ASOS STATIONS IS THE SUM OF THE CEILOMETER AND SATELLITE DATA FOR THE SUNRISE TO SUNSET PERIOD.
GENERAL CONTINUED:
CLEAR INDICATES 0–2 OKTAS, PARTLY CLOUDY INDICATES 3–6 OKTAS, AND CLOUDY INDICATES 7 OR 8 OKTAS. WHEN AT LEAST ONE OF THE ELEMENTS (CEILOMETER OR SATELLITE) IS MISSING, THE DAILY CLOUDINESS IS NOT COMPUTED.
WIND DIRECTION IS RECORDED IN TENS OF DEGREES (2 DIGITS) CLOCKWISE FROM TRUE NORTH. "00" INDICATES CALM. "36" INDICATES TRUE NORTH.
RESULTANT WIND IS THE VECTOR AVERAGE OF THE SPEED AND DIRECTION.
AVERAGE TEMPERATURE IS THE SUM OF THE MEAN DAILY MAXIMUM AND MINIMUM TEMPERATURE DIVIDED BY 2.
SNOWFALL DATA COMPRISE ALL FORMS OF FROZEN PRECIPITATION, INCLUDING HAIL.
A HEATING (COOLING) DEGREE DAY IS THE DIFFERENCE BETWEEN THE AVERAGE DAILY TEMPERATURE AND 65 F.
DRY BULB IS THE TEMPERATURE OF THE AMBIENT AIR.
DEW POINT IS THE TEMPERATURE TO WHICH THE AIR MUST BE COOLED TO ACHIEVE 100 PERCENT RELATIVE HUMIDITY.
WET BULB IS THE TEMPERATURE THE AIR WOULD HAVE IF THE MOISTURE CONTENT WAS INCREASED TO 100 PERCENT RELATIVE HUMIDITY.
ON JULY 1, 1996, THE NATIONAL WEATHER SERVICE BEGAN USING THE "METAR" OBSERVATION CODE THAT WAS ALREADY EMPLOYED BY MOST OTHER NATIONS OF THE WORLD. THE MOST NOTICEABLE DIFFERENCE IN THIS ANNUAL PUBLICATION WILL BE THE CHANGE IN UNITS FROM TENTHS TO EIGHTS (OKTAS) FOR REPORTING THE AMOUNT OF SKY COVER.

| HEATING DEGREE DAYS (base 65 F) 2001 CHICAGO, O'HARE INTERNATIONAL AIRPORT, IL (OR | |||||||||||||
| YEAR | JUL | AUG | SEP | OCT | NOV | DEC | JAN | FEB | MAR | APR | MAY | JUN | TOTAL |
| 1972-73 | 15 | 10 | 109 | 481 | 811 | 1269 | 1135 | 1012 | 645 | 503 | 311 | 0 | 6301 |
| 1973-74 | 0 | 0 | 72 | 244 | 687 | 1139 | 1240 | 1046 | 812 | 383 | 266 | 63 | 5952 |
| 1974-75 | 0 | 1 | 176 | 384 | 724 | 1072 | 1160 | 1078 | 951 | 643 | 152 | 30 | 6371 |
| 1975-76 | 1 | 0 | 147 | 303 | 531 | 1033 | 1392 | 859 | 681 | 411 | 285 | 17 | 5660 |
| 1976-77 | 0 | 9 | 119 | 522 | 973 | 1408 | 1679 | 1060 | 616 | 332 | 115 | 41 | 6874 |
| 1977-78 | 0 | 8 | 42 | 413 | 741 | 1254 | 1521 | 1346 | 1020 | 518 | 264 | 46 | 7173 |
| 1978-79 | 1 | 4 | 59 | 418 | 718 | 1206 | 1622 | 1360 | 879 | 580 | 233 | 30 | 7110 |
| 1979-80 | 16 | 19 | 62 | 382 | 722 | 967 | 1281 | 1254 | 995 | 558 | 198 | 83 | 6537 |
| 1980-81 | 0 | 3 | 71 | 511 | 746 | 1140 | 1308 | 1031 | 846 | 397 | 313 | 6 | 6372 |
| 1981-82 | 8 | 6 | 135 | 489 | 719 | 1236 | 1632 | 1213 | 922 | 608 | 93 | 118 | 7179 |
| 1982-83 | 7 | 37 | 152 | 372 | 772 | 891 | 1194 | 961 | 847 | 643 | 364 | 38 | 6278 |
| 1983-84 | 16 | 0 | 125 | 383 | 714 | 1568 | 1479 | 894 | 1095 | 575 | 300 | 18 | 7167 |
| 1984-85 | 19 | 1 | 189 | 320 | 807 | 1046 | 1563 | 1245 | 787 | 418 | 183 | 103 | 6681 |
| 1985-86 | 0 | 6 | 141 | 380 | 813 | 1480 | 1302 | 1142 | 765 | 417 | 202 | 74 | 6722 |
| 1986-87 | 3 | 29 | 64 | 343 | 863 | 1060 | 1205 | 866 | 742 | 432 | 162 | 14 | 5783 |
| 1987-88 | 4 | 19 | 74 | 541 | 629 | 1011 | 1396 | 1221 | 828 | 503 | 176 | 40 | 6442 |
| 1988-89 | 0 | 9 | 63 | 583 | 693 | 1149 | 1003 | 1265 | 882 | 540 | 261 | 43 | 6491 |
| 1989-90 | 0 | 5 | 131 | 344 | 813 | 1471 | 956 | 938 | 733 | 491 | 271 | 33 | 6186 |
| 1990-91 | 10 | 5 | 103 | 425 | 605 | 1120 | 1365 | 945 | 756 | 393 | 142 | 13 | 5882 |
| 1991-92 | 0 | 0 | 163 | 367 | 887 | 1066 | 1137 | 913 | 847 | 560 | 284 | 77 | 6301 |
| 1992-93 | 9 | 37 | 136 | 449 | 795 | 1122 | 1196 | 1133 | 948 | 595 | 184 | 69 | 6673 |
| 1993-94 | 0 | 3 | 185 | 479 | 784 | 1084 | 1516 | 1197 | 817 | 433 | 253 | 51 | 6802 |
| 1994-95 | 1 | 23 | 63 | 322 | 611 | 932 | 1262 | 1074 | 760 | 561 | 199 | 25 | 5833 |
| 1995-96 | 1 | 0 | 150 | 349 | 958 | 1193 | 1284 | 1124 | 1054 | 589 | 343 | 58 | 7103 |
| 1996-97 | 9 | 0 | 119 | 399 | 940 | 1148 | 1410 | 1003 | 832 | 587 | 344 | 53 | 6844 |
| 1997-98 | 9 | 4 | 77 | 406 | 852 | 1030 | 1091 | 732 | 813 | 449 | 87 | 69 | 5619 |
| 1998-99 | 0 | 0 | 35 | 289 | 598 | 933 | 1309 | 860 | 903 | 456 | 149 | 34 | 5566 |
| 1999-00 | 1 | 4 | 110 | 368 | 591 | 1081 | 1224 | 892 | 640 | 528 | 148 | 57 | 5644 |
| 2000-01 | 6 | 3 | 112 | 286 | 833 | 1512 | 1248 | 1085 | 948 | 374 | 205 | 88 | 6700 |
| 2001- | 5 | 0 | 128 | 394 | 496 | 973 | |||||||

| COOLING DEGREE DAYS (base 65 F) 2001 CHICAGO, O'HARE INTERNATIONAL AIRPORT | |||||||||||||
| YEAR | JAN | FEB | MAR | APR | MAY | JUN | JUL | AUG | SEP | OCT | NOV | DEC | ANNUAL |
| 1972 | 0 | 0 | 0 | 0 | 64 | 106 | 289 | 289 | 72 | 0 | 0 | 0 | 820 |
| 1973 | 0 | 0 | 0 | 5 | 3 | 189 | 308 | 301 | 108 | 32 | 0 | 0 | 946 |
| 1974 | 0 | 0 | 0 | 10 | 21 | 83 | 274 | 162 | 48 | 12 | 0 | 0 | 610 |
| 1975 | 0 | 0 | 0 | 0 | 76 | 203 | 332 | 358 | 46 | 24 | 1 | 0 | 1040 |
| 1976 | 0 | 0 | 0 | 36 | 6 | 178 | 286 | 196 | 56 | 8 | 0 | 0 | 766 |
| 1977 | 0 | 0 | 0 | 39 | 191 | 178 | 395 | 229 | 76 | 0 | 0 | 0 | 1108 |
| 1978 | 0 | 0 | 0 | 0 | 60 | 132 | 227 | 243 | 181 | 2 | 0 | 0 | 845 |
| 1979 | 0 | 0 | 0 | 2 | 61 | 164 | 241 | 213 | 99 | 26 | 0 | 0 | 806 |
| 1980 | 0 | 0 | 0 | 10 | 43 | 101 | 338 | 342 | 107 | 2 | 0 | 0 | 943 |
| 1981 | 0 | 0 | 0 | 9 | 20 | 157 | 248 | 204 | 44 | 0 | 0 | 0 | 682 |
| 1982 | 0 | 0 | 0 | 0 | 79 | 38 | 295 | 161 | 69 | 14 | 0 | 0 | 656 |
| 1983 | 0 | 0 | 1 | 0 | 4 | 189 | 385 | 388 | 122 | 10 | 0 | 0 | 1099 |
| 1984 | 0 | 0 | 0 | 5 | 11 | 184 | 190 | 254 | 77 | 8 | 0 | 0 | 729 |
| 1985 | 0 | 0 | 0 | 53 | 42 | 71 | 204 | 142 | 158 | 0 | 0 | 0 | 670 |
| 1986 | 0 | 0 | 7 | 17 | 37 | 118 | 318 | 145 | 123 | 3 | 0 | 0 | 768 |
| 1987 | 0 | 0 | 0 | 6 | 116 | 241 | 377 | 238 | 83 | 0 | 1 | 0 | 1062 |
| 1988 | 0 | 0 | 0 | 5 | 59 | 247 | 373 | 383 | 96 | 1 | 0 | 0 | 1164 |
| 1989 | 0 | 0 | 2 | 0 | 44 | 121 | 282 | 207 | 48 | 11 | 0 | 0 | 715 |
| 1990 | 0 | 0 | 7 | 43 | 8 | 179 | 226 | 224 | 137 | 11 | 1 | 0 | 836 |
| 1991 | 0 | 0 | 0 | 11 | 167 | 226 | 334 | 273 | 132 | 10 | 0 | 0 | 1153 |
| 1992 | 0 | 0 | 0 | 1 | 40 | 79 | 152 | 106 | 75 | 4 | 0 | 0 | 457 |
| 1993 | 0 | 0 | 0 | 0 | 28 | 118 | 294 | 266 | 19 | 5 | 0 | 0 | 730 |
| 1994 | 0 | 0 | 0 | 23 | 47 | 212 | 268 | 143 | 126 | 10 | 0 | 0 | 829 |
| 1995 | 0 | 0 | 0 | 0 | 13 | 254 | 398 | 445 | 81 | 8 | 0 | 0 | 1199 |
| 1996 | 0 | 0 | 0 | 0 | 41 | 154 | 166 | 235 | 79 | 2 | 0 | 0 | 677 |
| 1997 | 0 | 0 | 0 | 0 | 4 | 158 | 265 | 154 | 59 | 44 | 0 | 0 | 684 |
| 1998 | 0 | 0 | 13 | 0 | 88 | 205 | 301 | 267 | 123 | 5 | 0 | 0 | 1002 |
| 1999 | 0 | 0 | 0 | 0 | 52 | 201 | 422 | 176 | 70 | 2 | 2 | 0 | 925 |
| 2000 | 0 | 0 | 3 | 0 | 63 | 131 | 199 | 240 | 112 | 18 | 0 | 0 | 766 |
| 2001 | 0 | 0 | 0 | 7 | 58 | 168 | 309 | 262 | 44 | 1 | 0 | 0 | 849 |

| SNOWFALL (inches) 2001 CHICAGO, O'HARE INTERNATIONAL AIRPORT, IL (ORD) | |||||||||||||
| YEAR | JUL | AUG | SEP | OCT | NOV | DEC | JAN | FEB | MAR | APR | MAY | JUN | TOTAL |
| 1972-73 | 0.0 | 0.0 | 0.0 | 0.1 | 0.9 | 11.2 | 0.5 | 9.3 | 3.4 | 0.2 | T | 0.0 | 25.6 |
| 1973-74 | 0.0 | 0.0 | 0.0 | 0.0 | T | 18.8 | 7.4 | 9.6 | 1.4 | T | 0.0 | 0.0 | 37.2 |
| 1974-75 | 0.0 | 0.0 | 0.0 | 0.0 | 1.0 | 9.4 | 3.5 | 8.2 | 4.5 | 11.1 | 0.0 | 0.0 | 37.7 |
| 1975-76 | 0.0 | 0.0 | 0.0 | 0.0 | 6.4 | 6.8 | 10.0 | 1.6 | 1.9 | 0.8 | T | 0.0 | 27.5 |
| 1976-77 | 0.0 | 0.0 | 0.0 | 1.6 | 0.5 | 6.5 | 7.2 | 4.0 | 4.9 | T | 0.0 | 0.0 | 24.7 |
| 1977-78 | 0.0 | 0.0 | 0.0 | 0.0 | 5.2 | 12.7 | 21.9 | 7.9 | 4.5 | 0.2 | 0.0 | 0.0 | 52.4 |
| 1978-79 | 0.0 | 0.0 | 0.0 | 0.0 | 5.2 | 35.3 | 34.3 | 6.8 | 2.0 | 0.1 | 0.0 | 0.0 | 83.7 |
| 1979-80 | 0.0 | 0.0 | 0.0 | 0.0 | 4.0 | 0.9 | 6.2 | 14.7 | 11.6 | 4.2 | 0.0 | 0.0 | 41.6 |
| 1980-81 | 0.0 | 0.0 | 0.0 | T | 5.1 | 9.7 | 2.0 | 15.9 | 2.3 | 0.0 | 0.0 | 0.0 | 35.0 |
| 1981-82 | 0.0 | 0.0 | 0.0 | T | 3.6 | 4.9 | 21.1 | 4.8 | 14.3 | 10.6 | 0.0 | 0.0 | 59.3 |
| 1982-83 | 0.0 | 0.0 | 0.0 | 0.0 | 0.4 | 2.1 | 5.0 | 8.9 | 9.0 | 1.2 | 0.0 | 0.0 | 26.6 |
| 1983-84 | 0.0 | 0.0 | 0.0 | 0.0 | 1.0 | 16.5 | 17.2 | 1.9 | 9.7 | 2.7 | 0.0 | 0.0 | 49.0 |
| 1984-85 | 0.0 | 0.0 | 0.0 | 0.0 | T | 6.6 | 18.9 | 13.3 | 0.3 | T | 0.0 | 0.0 | 39.1 |
| 1985-86 | 0.0 | 0.0 | 0.0 | 0.0 | 1.1 | 5.2 | 6.9 | 10.9 | 4.1 | 0.8 | 0.0 | 0.0 | 29.0 |
| 1986-87 | 0.0 | 0.0 | 0.0 | T | 3.8 | 0.4 | 17.3 | T | 4.7 | T | 0.0 | 0.0 | 26.2 |
| 1987-88 | 0.0 | 0.0 | 0.0 | 0.1 | 1.0 | 18.7 | 5.4 | 15.5 | 1.9 | T | 0.0 | 0.0 | 42.6 |
| 1988-89 | 0.0 | 0.0 | 0.0 | T | 0.9 | 5.0 | 0.4 | 15.1 | 2.0 | 0.6 | 0.5 | 0.0 | 24.5 |
| 1989-90 | 0.0 | T | 0.0 | 6.3 | 3.9 | 5.4 | 3.2 | 13.6 | 1.3 | 0.1 | T | 0.0 | 33.8 |
| 1990-91 | 0.0 | 0.0 | 0.0 | T | T | 3.2 | 11.1 | 3.3 | 5.9 | T | 0.0 | 0.0 | 23.5 |
| 1991-92 | 0.0 | 0.0 | 0.0 | T | 1.2 | 7.6 | 5.6 | 1.3 | 11.6 | 1.1 | 0.0 | T | 28.4 |
| 1992-93 | T | 0.0 | 0.0 | 0.3 | 0.2 | 5.7 | 15.2 | 8.0 | 13.8 | 3.7 | 0.0 | 0.0 | 46.9 |
| 1993-94 | 0.0 | 0.0 | 0.0 | T | 0.2 | 1.2 | 14.2 | 26.2 | T | T | 0.0 | 0.0 | 41.8 |
| 1994-95 | 0.0 | 0.0 | 0.0 | 0.0 | T | 7.0 | 13.1 | 0.4 | 3.5 | 0.1 | 0.0 | 0.0 | 24.1 |
| 1995-96 | T | 0.0 | 0.0 | T | 3.9 | 9.9 | 5.9 | 0.3 | 3.9 | T | T | 0.0 | 23.9 |
| 1996-97 | 0.0 | 0.0 | |||||||||||
| 1997-98 | 11.0 | T | 8.2 | 0.0 | 0.0 | T | |||||||
| 1998-99 | 0.0 | 0.0 | 0.0 | 0.0 | 0.2 | 1.0 | 29.6 | 1.9 | 18.2 | 0.0 | 0.0 | 0.0 | 50.9 |
| 1999-00 | 0.0 | 0.0 | 0.0 | 0.0 | 0.0 | 3.5 | 13.6 | 11.6 | T | 1.6 | 0.0 | T | 30.3 |
| 2000-01 | 0.0 | 0.0 | 0.0 | T | 0.1 | 30.9 | 1.5 | 2.2 | 4.2 | 0.3 | T | T | 39.2 |
| 2001- | T | 0.0 | 0.0 | T | 0.0 | 1.6 | |||||||
| POR=41 YRS | T | T | T | 0.4 | 1.9 | 8.4 | 10.8 | 7.8 | 6.5 | 1.6 | 0.1 | T | 37.5 |