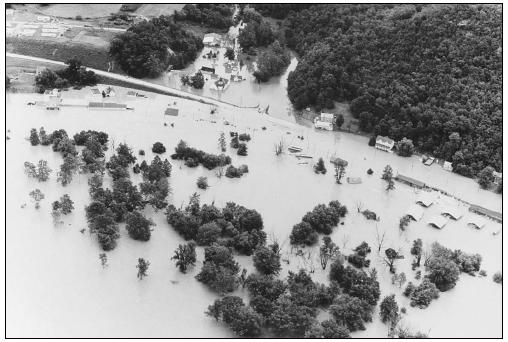
Floods & Flash Floods
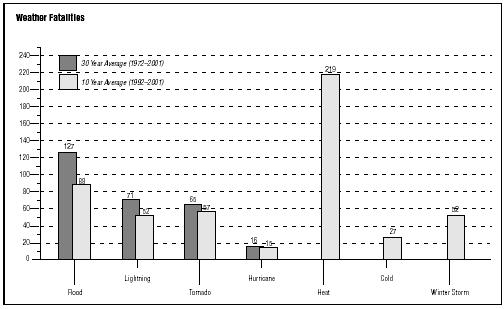
The transformation of a tranquil river or normally dry wash into a destructive flood occurs hundreds of times each year, in every part of the United States. Every year, floods drive some 75,000 Americans from their homes; on the average, 127 persons are killed each year. These destructive overflows have caused property damage in some years estimated at more than $2 billion. During the years 1985–2001, the total annual number of floods or flash floods ranged from 361 (1988) to 3,376 in 1998. A total of 32,047 flash flood/flood events were recorded in 1985–2001.
HOW FLOODS HAPPEN
Floods begin when soil and vegetation cannot absorb falling rain or melting snow, or when water runs off the land in such quantities that it cannot be carried in normal stream channels or retained in natural ponds and human-made reservoirs. Flash floods are the result of too much rain falling in too small an area, in too short a time. Flash floods frequently occur in seconds and minutes, while floods occur over hours and days. River Forecast Centers issue flood
forecasts and warnings when the rain that has fallen is enough to cause waterways to overflow their banks, and when melting snow combines with rainfall to produce similar effects.
FLASH FLOODS
Typically, flash floods occur primarily at night and when there is an abundance of atmospheric moisture; in addition, there is usually little, if any, vertical wind shear present. Flash flooding can be produced by large, slow-moving storms or as a result of "train effect" storms (i.e., sequential mature storms that release precipitation over the same area). Train effect storms can be part of multicell cluster or squall line storm systems.
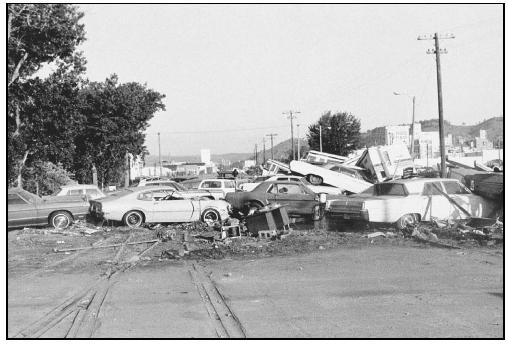
Flash-flood waves, moving at incredible speeds, can roll boulders, tear out trees, destroy buildings and bridges, and scour out new channels. Killing walls of water can reach 10–20 ft.
On small streams, especially near the headwaters of river basins, water levels may rise quickly in heavy rainstorms,
and flash floods can begin before the rain stops falling. There is little time between detection and flood crest. Swift action is essential for the protection of life and property.
FLOOD EVENTS
The Great Flood of 1993
In terms of precipitation amounts, record river stages, extent of flooding, persons displaced, crop and property damage, and flood duration, the Great Flood of 1993 was perhaps the worst hydrometeorological event to occur since the United States started to provide weather services in the late 1800s.
Record and near-record precipitation during the spring of 1993, on soil saturated from previous seasonal precipitation, resulted in flooding along many of the major river systems and their tributaries in the Upper Midwest during the summer of 1993.
Spring flooding began in March as a result of a previous wet fall, normal to above-normal snow accumulation, and rapid spring snowmelt accompanied by heavy spring rainfall.
By May 8, however, record flooding occurred in South Dakota on Split Rock Creek at Corson and in Minnesota on the Rock River in Luverne. On May 22–24, heavy thunderstorms produced 3–7 in of rain in three hours over Sioux Falls, South Dakota, resulting in major urban and residential flooding across the city. The Big Sioux and Vermillion Rivers in South Dakota went above flood stage in late May and remained in flood through mid-June. Major flooding continued throughout the summer along the Missouri and Mississippi Rivers—by September 1, 1993, for example, the towns of Hannibal, Louisiana, and Clarksville, Missouri, had experienced 153 consecutive days of flooding. Flooding at levels above the flood stages continued through the middle of September in many regions along the Mississippi River.
Records broken in 1993
In 1993, flood records were broken at 44 forecast points on the upper Mississippi River system, at 49 forecast points on the Missouri River system, and at two forecast points on the Red River of the North system. Within the Mississippi River system, 1993 floods of record include those set at 15 forecast points on the main stem, at four forecast points on the Iowa River, at five forecast points on the Des Moines River, and at two forecast points on the Raccoon River.
Within the Missouri River system, 1993 records were set at 14 forecast points on the main stem and at four forecast points on each of the Saline, Smoky Hill, and Grand Rivers. Record 1993 flood stages surpassed old record stages by more than 6 ft in some cases. For example, in 1993, flood records set more than 42 years ago on the main stem of the Missouri were broken by more than 4 ft at multiple forecast points. In at least one case, a new record was established early on but was broken by higher water later. The historic record on the Mississippi at St. Louis was established on April 28, 1973, at 43.2 ft; reestablished on July 21, 1993, with a flood stage of 46.9 ft; and again reestablished 11 days later on August 1, 1993, with a record flood stage of 49.6 ft.
Flood damages of 1993
Damage caused by these record flood stages was massive. Over 17,000 mi 2 were inundated by the flood (the 1937 flood in the same region affected only 12,700 mi 2 ). It is estimated that the region suffered over $8 billion in damages; President Clinton declared more than 200 counties federal disaster areas, including all 99 counties in Iowa. Amazingly, only 26 individuals died as a direct result of the flood. Compare that figure to 23 killed in the 1973 flood and 250 in the 1937 flood of the same region and then to the 2,100 killed in the one-day Jamestown, Pennsylvania, flood in 1889. The decreased death tolls can be attributed to abundant warnings, well-executed evacuation plans, lack of flash floods, and foremost, the protection provided by the system of flood-controlling levees in the area.
The duration and magnitude of the Great Flood of 1993, as well as its leading conditions, strongly support the premise that this event was a significant climate variation rather than simply a sequence of meteorological events. It is quite possible that one or more climate-driving forces significantly contributed to this variation. (For example, a shift in the jet stream acted as a barrier to a cold front, bringing 150–200% more precipitation to the area than usual.) A more thorough analysis of this situation is expected to result in improved understanding of the roles contributing factors may have played.
Flooding in California, 1995
In January and March of 1995, large sections of northern and central California were hit with heavy precipitation and subsequent flooding, resulting in record losses of $2–3 billion. Over 10,000 homes were lost or destroyed and 27 lives were lost. In the end, all state counties but one were declared federal disaster areas.
Throughout the early winter and spring of 1995, a strong and displaced Pacific jet stream funneled storm systems and heavy moisture into California. These systems produced severe thunderstorms and sometimes tornadoes. The heavier-than-normal precipitation flooded small streams; this flooding spread to tributaries and larger rivers. Precipitation
(which accumulated as snow) at altitudes of 5,000 ft or more also contributed to the flooding as melting and runoff. By March, the snow depth in some areas of the Sierra Nevada range were reported to be as high as 40 ft.
Floods of 1997
During the winter of 1996-97, substantial snow fell across north-central and western sections of the United States. As this snow began to melt, the potential for significant flooding existed across these areas. Heavy rainfall during February 1997 caused flooding across portions of the Southeast, middle and lower Mississippi Valley, and the Great Lakes regions, and added to the possibility of continued flooding in these areas with heavy spring rains. In early March, torrential rains of up to 12 in in 36 hours fell across the Ohio River Basin. This caused disastrous flooding throughout the basin, and the flood crest in March reached the confluence with the Mississippi.
Areas of elevated risk for spring flooding included the northern Plains, most of the Mississippi Valley, the western Great Lakes region, and much of the lower Missouri and Ohio Valleys, as well as a substantial area in the Southeast, extending from eastern Texas through South Carolina, excluding southern Alabama, Georgia, and all of Florida. Of particular concern were the Red River along the North Dakota-Minnesota state line, and the James River in South Dakota. There, the water content of the snow over the entire drainage south of Fargo, North Dakota, was exceptionally high and could cause serious flooding.
Flooding of March 1997
During February 1997, the middle third of the nation saw the passage of several very wet storm systems, and many of these areas accumulated more than 150% of normal precipitation for the month. In early March, this general pattern continued, and included the deluge that caused catastrophic flooding in portions of the Ohio Valley.
During late February or early March, a total of 18 states across the central and eastern United States were affected by river flooding, the most serious of which was observed along the south of the middle and lower Ohio River. Flow volume was reported four to 10 times the normal (for the date) along smaller rivers and creeks in Kentucky and Ohio alone. As of March 10, flooding had resulted in: 98 counties being declared federal disaster areas; damage to at least 100,000 structures; destruction of roads and bridges, and contamination of public water supplies; and the deaths of approximately 30 people.
Flood Safety Rules
Before the flood:
- Become familiar with local flood areas and dams; know if floodwaters might affect your home and property. Know your flood risk and elevation above flood stage and flood plain. Do local waterways, or rivers, and washes flood easily? If so, be prepared to move to a place of safety.
- Learn flood warning signals and community evacuation routes and shelters.
- Keep a stock of food that requires no cooking or refrigeration; electric and gas services may be interrupted.
- Keep a portable radio, emergency cooking equipment, lights, and flashlights in working order.
- Keep first-aid supplies and any medicines your family may need on hand.
- Store materials like sandbags, plywood, plastic sheeting, and lumber to protect your house from flood waters and to make quick repairs.
- Keep your car fueled. In an emergency, filling stations may not be operating.
- Contact your insurance agent or local government to discuss flood insurance coverage.
- Install check valves in building sewer traps to prevent flood water from backing up in sewer drains.
- Arrange for auxiliary electrical supplies for hospitals and other operations that are critically affected by power failure.
When you receive a flood warning:
- 11. Store drinking water in clean bathtubs and in various closed containers as water service may be disrupted.
- 12. In coastal areas, board up windows or protect them with storm shutters, or tape to prevent flying, broken glass.
- 13. Put sandbags or other protection in place, but away from outer walls. In the case of deep flooding you may opt to flood a basement with clean water.
- 14. If forced to leave your home and time permits: move essential items to safe ground or to upper levels of the house; turn off utilities at main switches, but do not touch electrical equipment if you are wet or standing in water; fill tanks to keep them from moving away; grease immovable machinery; leave a note on your house to advise authorities that you have evacuated.
- 15. Move to a safe area before access is cut off by flood water. Watch for mud slides, downed electrical lines, and areas with high or rising water levels.
During the flood:
- 16. Avoid areas subject to sudden flooding.
- 17. Do not drive into flooded areas. Even 2 ft of water will carry away most vehicles. If flood waters do rise around your car, abandon it and move to higher ground.
- 18. Do not swim or dive into the water.
After the flood:
- 19. Do not visit disaster areas; your presence might hamper rescue and other emergency operations.
- 20. If you have flood insurance, contact your agent that you have a loss.
- 21. Tune in to local radio and television for advice on where to obtain medical care and other assistance.
- 22. Do not enter structures if floodwaters have covered the first floor. Seek expert advice to determine if the building is safe to enter.
- 23. Use battery-powered lanterns or flashlights (not oil or gas lanterns); if the building may have a gas leak, do not use any kind of light.
- 24. Flood waters may have swollen doors tightly shut; use windows or other openings.
- 25. Check with local authorities before using any water; wells should be pumped out and water tested before drinking.
- 26. Do not use fresh food that has come into contact with flood waters.
- 27. Do not handle live electrical equipment in wet areas; have an expert check all equipment before returning to service.
- 28. Pump water out of basements gradually (one-third of the water per day) to lessen damage to walls and foundation.
- 29. Report broken utility lines to appropriate authorities; have the gas company check for leaks and to turn the gas back on.
- 30. Watch out for poisonous snakes in previously flooded areas.
Important flood terms:
FLOOD FORECASTS mean rainfall is heavy enough to cause rivers to overflow their banks, or melting snow is mixing with rainfall to produce similar effects.
FLOOD WARNINGS or forecasts of impending floods describe the affected river, lake, or tidewater, the severity of flooding (minor, moderate, or major), and when and where the flooding will begin.
Pacific Northwest floods, 1997
In 1997, there was also serious concern for spring flooding in the northern and central Rocky Mountains—particularly in Idaho and Montana—and in parts of Wyoming, Utah, and Colorado, as snow pack totals were well above average. Most of the higher elevations of Washington and northern Oregon also had much above-average snow packs and were in some jeopardy of flooding. Finally, deep snow packs in the central and southern Sierra Nevada increased the possibility of snowmelt flooding in western Nevada and in the Sacramento and San Joaquin River drainages in California.
Precipitation and snow accumulation since the end of January was lighter than normal throughout much of the West. In particular, there was some optimism that areas along the West Coast, disastrously inundated at the start of the year, might escape the spring without additional serious flooding. This dry period allowed water managers to draw down reservoirs to provide storage capacity for at least some of the spring snowmelt. Many reservoirs had filled to very high levels earlier in the year.
PRECIPITATION WORLDWIDE IN 2000
Global precipitation was also above-average in 2000. It is estimated that 2000 ended as one of the 10 wettest years on record. Precipitation in the tropics was heavily influenced by La Niña throughout much of the year, with above average precipitation in Indonesia and the western tropical Pacific, while drier than normal conditions were common in the central tropical Pacific. La Niña also contributed to above normal precipitation in northeast South America and southern Africa and enhanced monsoonal precipitation in southern Asia. Below normal precipitation across equatorial areas of East Africa and the Gulf Coast of the United States is also attributable to La Niña conditions.
PRECIPITATION WORLDWIDE IN 2001
Global precipitation was below the 1961–1990 average in 2001. A drought that has persisted for nearly three years continued in 2001 across Afghanistan, Pakistan, and neighboring countries. In Iran, estimated agricultural losses approached $2.6 billion (USD). Much of Central America experienced drought during the middle part of the year, which is traditionally the rainy season. Late season tropical activity eased drought in these areas, although drought in Honduras and neighboring regions continued through the latter part of 2001. In Africa, drought in Kenya persisted during 2001, despite one of the wettest Januaries in 40 years. In Australia, drought affected much of Western Australia and parts of Queensland.
Several typhoons brought excessive rains to parts of Southeast Asia, including the southeast coast of China, Taiwan, the Philippines, and Vietnam. Monsoon rains in Southeast Asia promoted extensive flooding along the Mekong Delta with at least several hundred deaths between August and October. Across Siberia, spring rains and a rapid thaw brought flooding across a vast area from the Ural Mountains to the Russian Far East, with some of the worst flooding in the Sakha region along the Lena River. A third consecutive year of spring flooding along the Tisza River in Hungary displaced tens of thousands of people from their homes, with the Tisza rising to its highest level in 100 years by early March.
PRECIPITATION IN THE UNITED STATES FOR 2001
Precipitation was below average for the conterminous United States in 2001. The estimated January–December anomaly was 0.7 inches below the long-term mean. This value could change based on conditions in December. This year marked the third consecutive year of below normal precipitation, following nine years of precipitation surpluses.
PRELIMINARY GLOBAL PRECIPITATION FOR 2002
Global precipitation was below the 1961–1990 average in 2002. Much of Australia experienced severe drought, with the eastern part of the country the worst affected. India monsoon rainfall was 19% below normal, with the resulting drought characterized as the worst since 1987. Other drought-affected areas included the western United States and portions of the north coast of China.
After a dry beginning to 2002, several typhoons brought excessive rains to parts of Southeast Asia and Japan, the southeast coast of China, Taiwan, and the Philippines. In contrast to drought conditions during the first half of 2002, the onset of monsoon rains in Southeast Asia promoted extensive flooding along the Mekong Delta. Seasonal flooding in much of south Asia (Nepal, Bangladesh, and northeastern India) during June–August claimed more than 1,000 lives. In the eastern United States, long-term drought was ameliorated by a turn to wetter weather, due in part to moisture from tropical systems.
PRELIMINARY NATIONAL PRECIPITATION FOR 2002
During 2002, more than a tenth of the country was very dry in 8 of the 11 months, and in February and May more than 20% of the country was very dry. Only in September and October did the percentage area of very wet conditions exceed 10%, though in October more than 20% of the country was very wet. This was due in part to several landfalling tropical systems during these two months. Drought improvement generally occurred in the eastern U.S. during 2002, while in much of the western half of the country and the central and southern Great Lakes drought worsened.
Precipitation in the United States in 2002 was characterized by extreme dryness in the West, above-average wetness in the Mississippi Valley region, and dryness giving way to near average conditions for the East. Colorado is on pace to have its driest year on record during 2002, and Wyoming and Arizona to have their second driest years. Eight states will likely be much drier than normal, and the West region as a whole will be the driest on record.
Louisiana had its wettest fall on record, in part due to two landfalling tropical systems that hit the state in September and October. It was the third driest July and August combined for the Northeast. Considerable improvement in drought conditions for the East Coast occurred in the fall.
FLOOD WARNINGS
Early flood warnings allow time for residents to leave low-lying areas, and to move personal property, mobile equipment, and livestock to higher ground. Sometimes valuable crops can be harvested in advance of a destructive flood. Emergency and relief organizations can prepare to handle refugees and combat the inevitable health hazards caused by floods.
Flood warnings are forecasts of impending floods, and are distributed to the public by radio and television, and through local emergency forces. The warning message tells the expected severity of flooding (minor, moderate, or major), the affected river, and when and where flooding will begin. Careful preparation and prompt response will reduce property loss and ensure personal safety.
Flash-flood warnings can be issued in minutes and flood warnings can be issued hours to days in advance of the flood peak on major tributaries. Main river flood forecasts can be issued several days or even weeks in advance. In general, the time lapse between rainfall or snowmelt and the rise in river height increases with the size of the river.
WARNING SYSTEMS
Thirteen regional river forecast centers are the first echelon offices that prepare river and flood forecasts and warnings for approximately 3,000 communities.
National Oceanic and Atmospheric Administration's National Weather Service (NWS) has helped set up additional flash-flood warning systems in about 100 communities. In these, a volunteer network of rainfall and river-observing stations is established in the area, and a local flood warning representative is appointed to collect reports from the network. The representative is authorized to issue official flash-flood warnings based on a series of graphs prepared by the NWS. These graphs show the local flooding that will occur under different conditions of soil moisture and rainfall. On the basis of reported rainfall, the representative can prepare a flood forecast from these graphs, and spread a warning within minutes. (Flash-flood warnings are the most urgent type of flood warning issued, and are transmitted to the public over radio, television, and by sirens and other signals.) Communities within range of a NWS radar have the additional protection of advance warning when flood-producing storms approach.
Successful operation of a flash-flood warning system requires active community participation and planning, but very little financial outlay. Still, the communities with cooperative flash-flood warning systems are only a small fraction of the thousands of communities that need them.
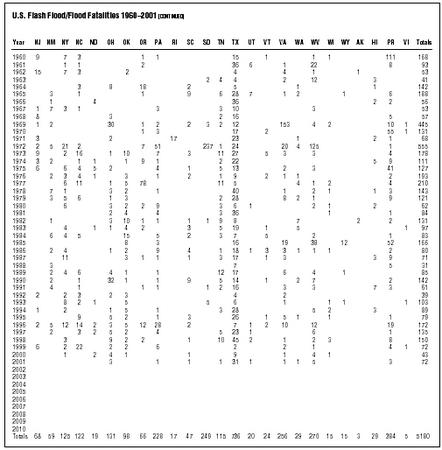
Flood Casualties
During 1960–2001, a total of 5,180 people died in the United States, Puerto Rico, and the Virgin Islands combined due to flash floods and floods. Most flash-flood fatalities (56%) are vehicle related and more than two-thirds (65%) are males.
The state with the most flash-flood/flood deaths during the past 42 years—with more than double the next states—is Texas, followed by totals of closely grouped states—California, West Virginia, Virginia, and South Dakota (Puerto Rico ranks just behind Texas).
All but 11 of the 249 fatalities in South Dakota occurred during the flash floods in the Rapid City area June 9–10, 1972, and more than half of the deaths in Virginia occurred during the August 1969 floods in the western portion of the state. Most of the Colorado deaths (83%) occurred during the Big Thompson Canyon flash flood, August 1, 1976.
States with Highest Flash-Flood/Flood Fatality Statistics, 1960–2001
- Texas (736)
- California (313)
- West Virginia (270)
- Virginia (256)
- South Dakota (249)
- Pennsylvania (228)
Totals by decades: 1960–69: 1,296; 1970–79: 1,837; 1980–89: 890; 1990–99: 1,042 2000–01: 115.
The flash-flood/flood totals include deaths during tropical cyclones. Years with the greatest totals can be directly tied to those years with major landfalling hurricanes (e.g., Betsy in 1965, Camille in 1969, and Agnes in 1972).
Sources: Richard A. Wood; National Weather Service, Office of Hydrology, and National Climatic Data Center ("Storm Data" publications).
USGS FLOOD MEASUREMENTS
The USGS currently (2000) maintains more than 7,000 stream-gaging stations throughout the United States, Puerto Rico, and the Virgin Islands that monitor streamflow and provide data to various federal, state, and local cooperating agencies as well as the general public. Some of these stream-gauging stations have been in operation since before 1900, providing more than a century of water information for the nation. In addition to providing critical information on flood heights and discharges, these stations provide data used in the effective management of water-supply and water-quality needs, protection of aquatic habitat, recreation, and water-resources research.
The basic building block for a stream-flow data network is the stage-discharge relation that is developed at each gauging-station location. Measurements of the flow (discharge) are related graphically to the respective water depths (stage), which then enables discharge to be determined from stage data.
Discharge measurements can either be direct, using a current meter, or indirect, using mathematical flow equations. Both methods require that an elevation of the flood-water surface be determined by a water-depth gauge or by a detailed survey of high-water marks. If time allows and conditions are safe, a direct measurement by USGS hydrographers is preferred. However, during major floods, direct measurements are often impossible or extremely dangerous, and indirect methods must be used.
Accurate identification and measurement of high-water marks from floods are very important in the accurate mapping of inundated areas as well as in the analysis of water-surface profiles for indirect discharge measurements. These elevations, in combination with flood-frequency analysis using many years of annual flood maximums, are used by the Federal Emergency Management Agency (FEMA) to determine flood-insurance rates.
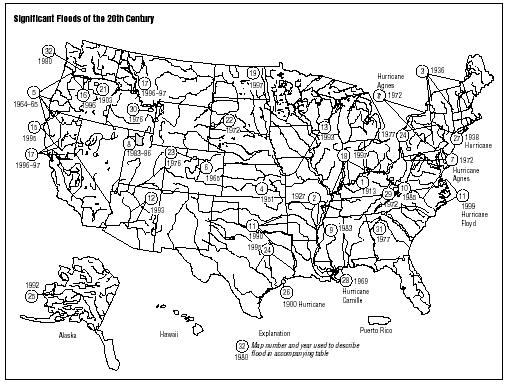
SIGNIFICANT FLOODS OF THE TWENTIETH CENTURY
During the twentieth century, floods were the number-one natural disaster in the United States in terms of number of lives lost and property damaged. They can occur at any time of the year, in any part of the country, and at any time of the day or night. Most lives are lost when people are swept away by flood currents, whereas most property damage results from inundation by sediment-laden water. Flood currents also possess tremendous destructive power, as lateral forces can demolish buildings and erosion can undermine bridge foundations and footings leading to the collapse of structures. The accompanying map and table locate and describe 32 of the most significant floods of the twentieth century.
Flash-Flood Safety Rules
BEFORE THE FLOOD know the elevation of your property in relation to nearby streams and other waterways. Investigate the flood history of your area and how human-made changes may affect future flooding. Make advance plans of what you will do and where you will go in a flash-flood emergency.
WHEN A FLASH-FLOOD WATCH IS ISSUED listen to area radio and television stations for possible Flash-Flood Warnings and reports of flooding in progress from the National Weather Service and public safety agencies. Be prepared to move out of danger at a moment's notice. If you are on the road, watch for flooding at highway dips, bridges, and low areas due to heavy rain not observable to you, but which may be indicated by thunder and lightning.
WHEN A FLASH-FLOOD WARNING IS ISSUED for your area act quickly to save yourself. You may have only seconds:
- Get out of areas subject to flooding. Avoid already flooded areas. This includes dips, low spots, canyons, washes, etc.
- Do not attempt to cross a flowing stream on foot where water is above your ankles.
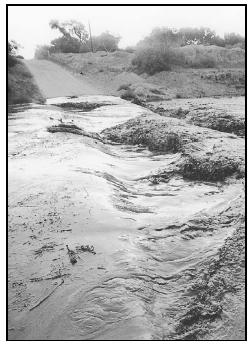
- If driving, know the depth of water in a dip before crossing. The road may not be intact under the water. If the vehicle stalls, abandon it immediately and seek higher ground—rapidly rising water may engulf the vehicle and its occupants and sweep them away. The depth of the water is not always obvious.
- Be especially cautious at night when it is more difficult to recognize flood dangers.
- When out of immediate danger, tune in area radio or television stations for additional information as conditions change and new reports are received.
- Children should never play around high water, storm drains, viaducts, or arroyos.
- Do not camp or park vehicles along streams or washes, particularly during threatening conditions.
AFTER THE FLASH-FLOOD WATCH OR WARNING IS CANCELED stay tuned to radio or television for follow-up information. Flash flooding may have ended, but general flooding may come later in headwater streams and major rivers.
Flash-flood terms used in forecasts and warnings:
FLASH FLOOD means the occurrence of a dangerous rise in water level of a stream or over a land area in a few hours or less caused by heavy rain, ice-jam breakup, earthquake, or dam failure.
FLASH-FLOOD WATCH means that heavy rains occurring or expected to occur may soon cause flash flooding in certain areas and citizens should be alert to the possibility of a flood emergency that will require immediate action.
FLASH-FLOOD WARNING means that flash flooding is occurring or imminent on certain streams or designated areas and immediate precautions should be taken by those threatened.
Floods are the result of a multitude of naturally occurring and human-induced factors, but they all can be defined as the accumulation of too much water in too little time in a
specific area. Types of floods include regional floods; flash floods; ice-jam floods; storm-surge floods; dam- and levee-failure floods; and debris, landslide, and mudflow floods.
Regional floods
Some regional floods occur seasonally when winter or spring rains, coupled with melting snow, fill river basins with too much water too quickly. The ground may be frozen, reducing infiltration into the soil and thereby increasing runoff. Such was the case for the New England flood of March 1936, in which more than 150 lives were lost and property damage totaled $300 million.
Extended wet periods during any part of the year can create saturated soil conditions, after which any additional rain runs off into streams and rivers, until river capacities are exceeded. Regional floods are many times associated with slow-moving, low-pressure, or frontal storm systems, including decaying hurricanes or tropical storms. Persistent wet meteorological patterns are usually responsible for very large regional floods, such as the Mississippi River Basin flood of 1993 wherein damages were $20 billion.
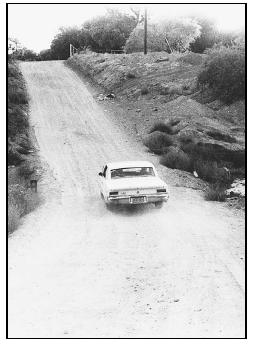
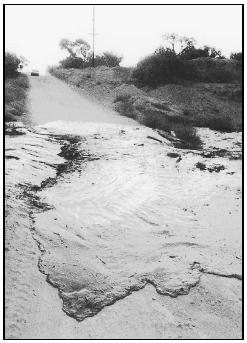
Flash floods
Flash floods can occur within several seconds to several hours, with little warning. Flash floods can be deadly because they produce rapid rises in water levels and have devastating flow velocities. Several factors can contribute to flash flooding. Among these are rainfall intensity, rainfall duration, surface conditions, and topography and slope of the receiving basin. Urban areas are susceptible to flash floods because a high percentage of the surface area is composed of impervious streets, roofs, and parking lots where runoff occurs very rapidly. Mountainous areas also are susceptible to flash floods, as steep topography may funnel runoff into a narrow canyon. Floodwaters accelerated by steep stream slopes can cause the floodwave to move downstream too fast to allow escape, resulting in many deaths. A
Significant Floods of the 20th Century
[M, million; B, billion]
| Flood type | Map no. | Date | Area or stream with flooding | Reported deaths | Approximate cost (uninflated) | Comments |
| Regional flood | 1 | Mar.-Apr. 1913 | Ohio, statewide | 467 | $143M | Excessive Regional rain. |
| 2 | Apr.-May 1927 | Mississippi River from Missouri to Louisiana | unknown | $230M | Record discharge downstream from Cairo, Illinois. | |
| 3 | Mar. 1936 | New England | 150+ | $300M | Excessive rainfall on snow. | |
| 4 | July 1951 | Kansas and Neosho River Basins in Kansas | 15 | $800M | Excessive regional rain. | |
| 5 | Dec. 1964-Jan. 1965 | Pacific Northwest | 47 | $430M | Excessive rainfall on snow. | |
| 6 | June 1965 | South Platte and Arkansas Rivers in Colorado | 24 | $570M | 14 inches of rain in a few hours in eastern Colorado. | |
| 7 | June 1972 | Northeastern United States | 117 | $3.2B | Extra tropical remnants of Hurricane Agnes. | |
| 8 | Apr.-June 1983 | Shoreline of Great Salt Lake, Utah | unknown | $621M | In June 1986, the Great Salt Lake reached its highest elevation and caused $268M more in property damage. | |
| 9 | May 1983 | Central and northeast Mississippi | 1 | $500M | Excessive regional rain. | |
| 10 | Nov. 1985 | Shenandoah, James, and Roanoke Rivers in Virginia and West Virginia | 69 | $1.25B | Excessive regional rain. | |
| 11 | Apr. 1990 | Trinity Arkansas, and Red Rivers in Texas, Arkansas, and Oklahoma | 17 | $1B | Recurring intense thunderstorms. | |
| 12 | Jan. 1993 | Gila, Salt, and Santa Cruz Rivers in Arizona | unknown | $400M | Persistent winter precipitation. | |
| 13 | May-Sept. 1993 | Mississippi River Basin in central United States | 48 | $20B | Long period of excessive rainfall. | |
| 14 | May 1995 | South-central United States | 32 | $5-6B | Rain from recurring thunderstorms. | |
| 15 | Jan.-Mar. 1995 | California | 27 | $3B | Frequent winter storms. | |
| 16 | Feb. 1996 | Pacific Northwest and western Montana | 9 | $1B | Torrential rains and snowmelt | |
| 17 | Dec. 1996-Jan. 1997 | Pacific Northwest and Montana | 36 | $2-3B | Torrential rains and snowmelt | |
| 18 | Mar. 1997 | Ohio River and tributaries | 50+ | $500M | Slow-moving frontal system. | |
| 19 | Apr.-May 1997 | Red River of the North in North Nakota and Minnesota | 8 | $2B | Very rapid snowmelt. | |
| 20 | Sept. 1999 | Eastern North Carolina | 42 | $6B | Slow-moving Hurricane Floyd. | |
| Flash flood | 21 | June 14, 1903 | Willow Creek in Oregon | 225 | unknown | City of Heppner, Oregon, destroyed. |
| 22 | June 9-10, 1972 | Rapid City, South Dakota | 237 | $160M | 15 inches of rain in 5 hours. | |
| 23 | July 31, 1976 | Big Thompson and Cachela Poudre Rivers in Colorado | 144 | $39M | Flash flood in canyon after excessive rainfall. | |
| 24 | July 19-20, 1977 | Conemaugh River in Pennsylvania | 78 | $300M | 12 inches of rain in 6-8 hours. | |
| Ice-jam flood | 25 | May 1992 | Yukon River in Alaska | 0 | unknown | 100-year flood on Yukon River. |
| Storm-surge flood | 26 | Sept. 1900 | Galveston, Texas | 6,000+ | unknown | Hurricane |
| 27 | Sept. 1938 | Northeast United States | 494 | $306M | Hurricane | |
| 28 | Aug. 1969 | Gulf Coast, Mississippi and Louisiana | 259 | $1.4B | Hurricane Camille | |
| Dam-failure flood | 29 | Feb. 2, 1972 | Buffalo Creek in West Virginia | 125 | $60M | Dam failure aafter excessive rainfall. |
| 30 | June 5, 1976 | Teton River in Idaho | 11 | $400M | Earthen dam breached. | |
| 31 | Nov. 8, 1977 | Toccoa Creek in Georgia | 39 | $2.8M | Dam failure after excessive rainfall. | |
| Mudflow flood | 32 | May 18, 1980 | Toutle and lower Cowlitz Rivers in Washington | 60 | unknown | Result of eruption of Mt. St. Helens. |
flash flood caused by 15 inches of rain in 5 hours from slow-moving thunderstorms killed 237 people in Rapid City, South Dakota, in 1972.
Floodwaves more than 30-feet high have occurred many miles from the rainfall area, catching people unaware. Even desert arroyos are not immune to flash floods, as distant thunderstorms can produce rapid rises in water levels in otherwise dry channels. Early-warning gauges upstream save lives by providing advanced notice of potential deadly floodwaves.
Ice-Jam Floods
Ice-jam floods occur on rivers that are totally or partially frozen. A rise in stream stage will break up a totally frozen river and create ice flows that can pile up on channel obstructions such as shallow riffles, log jams, or bridge piers. The jammed ice creates a dam across the channel over which the water and ice mixture continues to flow, allowing for more jamming to occur. Backwater upstream from the ice dam can rise rapidly and overflow the channel banks. Flooding moves downstream when the ice dam fails, and the water stored behind the dam is released. At this time the flood takes on the characteristics of a flash flood, with the added danger of ice flows that, when driven by the energy of the floodwave, can inflict serious damage on structures. An added danger of being caught in an ice-jam flood is hypothermia, which can kill quickly. Ice jams on the Yukon River in Alaska contributed to severe flooding during the spring breakup of 1992.
Storm-Surge Floods
Storm-surge flooding is water that is pushed up onto otherwise dry land by onshore winds. Friction between the water and the moving air creates drag that, depending upon the distance of water (fetch) and the velocity of the wind, can pile water up to depths greater than 20 feet. Intense low-pressure systems and hurricanes can create storm-surge flooding. The storm surge is unquestionably the most dangerous kind of flood. Nine out of 10 hurricane fatalities are caused by the storm surge. Worst-case scenarios occur when the storm surge occurs concurrently with high tide. Stream flooding is much worse inland during the storm surge because of backwater effects. In September 1900, the hurricane and storm surge at Galveston, Texas, killed more than 6,000 people, making it the worst natural disaster in the nation's history.
Dam- and levee-failure floods
Dams and levees are built for flood protection. They usually are engineered to withstand a flood with a computed risk of occurrence. For example, a dam or levee may be designed to contain a flood at a location on a stream that has a certain probability of occurring in any one year. If a larger flood occurs, then that structure will be overtopped. If during the overtopping the dam or levee fails or is washed out, the water behind it is released to become a flash flood. Failed dams or levees can create floods that are catastrophic to life and property because of the tremendous energy of the released water. Warnings of the Teton Dam failure in Idaho in June 1976 reduced the loss of life to 11 people.
Weather Anecdotes
October 16–18, 1994 … The nation's number one atmospheric natural hazard killer is flash floods and floods. A total of 17 people lost their lives in a three-day period in southeastern Texas due to flash flooding. In an average year, about 56% of all deaths due to flash flooding are vehicle related.
November 28, 1993 … Hamilton Township, PA. Two women were stranded in their vehicle when they drove onto a flooded roadway. According to them, "we hit some water—we thought it was a puddle." The puddle turned out to be the rain-swollen Back Creek. Both were swept down stream, but managed to climb on top of their car. One of them swam to safety, the other was rescued by fire fighters. When in doubt, stay out of waterways. Drive to a safe bridge or wait out the high water. If stuck, leave immediately and seek higher ground, probably the way you came in.
November 27, 1993 … Two cars were stranded on a Blair County, PA, road near Geeseytown. A woman was forced to abandon her car after it became submerged. The swift current carried her downstream about 200 yards where she grabbed a tree limb and held on for about two hours. In an attempt to rescue the woman, two fire fighters were also stranded when their boat capsized. All three individuals were treated for exposure at local hospitals.
Debris, landslide, and mudflow floods
Debris or landslide floods are created by the accumulation of debris, mud, rocks, or logs in a channel, which form a temporary dam. Flooding occurs upstream as water becomes stored behind the temporary dam and then becomes a flash flood as the dam is breached and rapidly washes away. Landslides can create large waves on lakes or embayments and can be deadly. Mudflow floods can occur when volcanic activity rapidly melts mountain snow and glaciers, and the water mixed with mud and debris moves rapidly downslope. These mudflow events are also called lahars and, after the eruption of Mt. St. Helens in 1980, caused significant damage downstream along the Toutle and Cowlitz Rivers in southwest Washington.
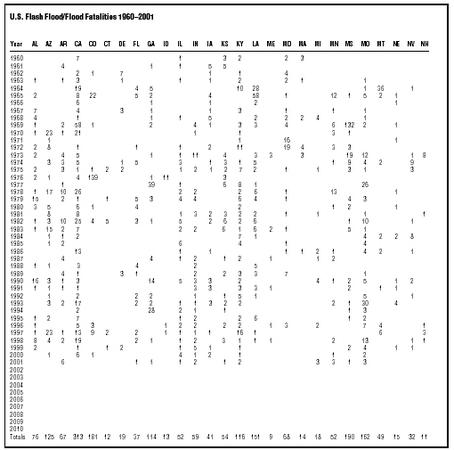
U.S. Flash Flood/Flood Fatalities 1960-2001 [CONTINUED]
| Year | AL | AZ | AR | CA | CO | CT | DE | FL | GA | ID | IL | IN | IA | KS | KY | LA | ME | MD | MA | MI | MN | MS | MO | MT | NE | NV | NH | |
| 1960 | 7 | 1 | 3 | 2 | 2 | 3 | ||||||||||||||||||||||
| 1961 | 4 | 1 | 1 | 5 | 5 | |||||||||||||||||||||||
| 1962 | 2 | 1 | 7 | 1 | 1 | 4 | ||||||||||||||||||||||
| 1963 | 1 | 1 | 3 | 1 | 1 | 1 | 2 | 2 | 1 | 1 | ||||||||||||||||||
| 1964 | 19 | 4 | 5 | 10 | 28 | 1 | 36 | 1 | ||||||||||||||||||||
| 1965 | 2 | 8 | 22 | 5 | 2 | 4 | 58 | 1 | 12 | 1 | 5 | 2 | 1 | |||||||||||||||
| 1966 | 6 | 1 | 1 | 2 | 1 | |||||||||||||||||||||||
| 1967 | 7 | 4 | 3 | 1 | 1 | 3 | 1 | 1 | 1 | |||||||||||||||||||
| 1968 | 4 | 1 | 1 | 1 | 5 | 2 | 2 | 2 | 4 | 1 | ||||||||||||||||||
| 1969 | 1 | 2 | 58 | 1 | 2 | 4 | 1 | 3 | 3 | 4 | 6 | 132 | 2 | 1 | ||||||||||||||
| 1970 | 1 | 23 | 1 | 21 | 1 | 1 | 3 | 1 | ||||||||||||||||||||
| 1971 | 1 | 1 | 16 | 1 | ||||||||||||||||||||||||
| 1972 | 2 | 8 | 1 | 1 | 1 | 2 | 11 | 19 | 4 | 3 | 3 | |||||||||||||||||
| 1973 | 2 | 4 | 5 | 1 | 1 | 11 | 4 | 3 | 3 | 3 | 19 | 12 | 1 | 8 | ||||||||||||||
| 1974 | 3 | 3 | 5 | 1 | 5 | 3 | 1 | 3 | 1 | 5 | 1 | 9 | 4 | 2 | 9 | |||||||||||||
| 1975 | 2 | 3 | 1 | 1 | 2 | 2 | 1 | 2 | 1 | 2 | 7 | 2 | 1 | 1 | 31 | 3 | ||||||||||||
| 1976 | 2 | 1 | 4 | 139 | 1 | 11 | 3 | |||||||||||||||||||||
| 1977 | 1 | 39 | 1 | 6 | 8 | 1 | 26 | |||||||||||||||||||||
| 1978 | 1 | 17 | 10 | 26 | 2 | 2 | 2 | 6 | 1 | 13 | 1 | |||||||||||||||||
| 1979 | 15 | 2 | 1 | 1 | 5 | 3 | 4 | 4 | 6 | 4 | 1 | 4 | 3 | |||||||||||||||
| 1980 | 3 | 5 | 6 | 1 | 4 | 2 | 1 | 2 | 1 | |||||||||||||||||||
| 1981 | 8 | 8 | 1 | 3 | 2 | 3 | 2 | 2 | 1 | 1 | 1 | 1 | ||||||||||||||||
| 1982 | 1 | 3 | 10 | 25 | 4 | 5 | 3 | 1 | 5 | 2 | 6 | 2 | 6 | 110 | 1 | |||||||||||||
| 1983 | 1 | 15 | 2 | 7 | 2 | 2 | 6 | 1 | 6 | 2 | 1 | 5 | 1 | |||||||||||||||
| 1984 | 1 | 1 | 2 | 7 | 1 | 4 | 2 | 2 | 8 | |||||||||||||||||||
| 1985 | 1 | 2 | 6 | 4 | 1 | 4 | ||||||||||||||||||||||
| 1986 | 13 | 1 | 1 | 1 | 1 | 2 | 1 | 4 | 2 | 1 | ||||||||||||||||||
| 1987 | 4 | 4 | 1 | 2 | 1 | 2 | 1 | 1 | 2 | |||||||||||||||||||
| 1988 | 1 | 1 | 3 | 4 | 2 | 5 | ||||||||||||||||||||||
| 1989 | 4 | 1 | 3 | 1 | 2 | 2 | 3 | 3 | 7 | 1 | ||||||||||||||||||
| 1990 | 16 | 3 | 1 | 3 | 14 | 5 | 3 | 3 | 2 | 4 | 1 | 2 | 5 | 1 | 2 | |||||||||||||
| 1991 | 1 | 1 | 1 | 1 | 3 | 3 | 3 | 3 | 1 | 2 | 1 | 1 | ||||||||||||||||
| 1992 | 1 | 2 | 2 | 2 | 1 | 1 | 5 | 1 | 5 | 1 | ||||||||||||||||||
| 1993 | 3 | 2 | 17 | 2 | 2 | 1 | 1 | 3 | 2 | 2 | 2 | 130 | 4 | |||||||||||||||
| 1994 | 2 | 28 | 2 | 1 | 1 | 1 | 3 | |||||||||||||||||||||
| 1995 | 1 | 2 | 7 | 1 | 2 | 2 | 6 | 1 | 2 | |||||||||||||||||||
| 1996 | 1 | 5 | 3 | 1 | 2 | 2 | 2 | 2 | 1 | 3 | 2 | 7 | 4 | 1 | ||||||||||||||
| 1997 | 1 | 23 | 1 | 13 | 9 | 2 | 2 | 1 | 1 | 1 | 1 | 161 | 6 | 3 | ||||||||||||||
| 1998 | 8 | 4 | 2 | 19 | 2 | 1 | 1 | 2 | 3 | 1 | 1 | 1 | 2 | 13 | 1 | 1 | ||||||||||||
| 1999 | 2 | 1 | 1 | 2 | 1 | 5 | 1 | 1 | 2 | 4 | 1 | 1 | ||||||||||||||||
| 2000 | 1 | 6 | 1 | 4 | 1 | 2 | 1 | 1 | 2 | |||||||||||||||||||
| 2001 | 6 | 1 | 1 | 1 | 2 | 1 | 2 | 3 | 3 | 1 | 3 | |||||||||||||||||
| 2002 | ||||||||||||||||||||||||||||
| 2003 | ||||||||||||||||||||||||||||
| 2004 | ||||||||||||||||||||||||||||
| 2005 | ||||||||||||||||||||||||||||
| 2006 | ||||||||||||||||||||||||||||
| 2007 | ||||||||||||||||||||||||||||
| 2008 | ||||||||||||||||||||||||||||
| 2009 | ||||||||||||||||||||||||||||
| 2010 | ||||||||||||||||||||||||||||
| Totals | 76 | 125 | 67 | 313 | 181 | 12 | 19 | 37 | 114 | 13 | 52 | 59 | 41 | 54 | 116 | 151 | 9 | 68 | 14 | 18 | 52 | 190 | 162 | 49 | 15 | 32 | 11 |
(Chart by GGS. Data compiled by Richard A. Wood, Ph.D.)
| Year | NJ | NM | NY | NC | ND | OH | OK | OR | PA | RI | SC | SD | TN | TX | UT | VT | VA | WA | WV | WI | WY | AK | HI | PR | VI | Totals |
| 1960 | 9 | 7 | 3 | 1 | 1 | 15 | 1 | 1 | 1 | 111 | 168 | |||||||||||||||
| 1961 | 1 | 1 | 2 | 36 | 6 | 1 | 22 | 8 | 93 | |||||||||||||||||
| 1962 | 15 | 7 | 3 | 2 | 4 | 4 | 1 | 1 | 53 | |||||||||||||||||
| 1963 | 2 | 4 | 4 | 2 | 12 | 3 | 41 | |||||||||||||||||||
| 1964 | 3 | 8 | 18 | 2 | 5 | 1 | 1 | 142 | ||||||||||||||||||
| 1965 | 3 | 1 | 1 | 9 | 6 | 28 | 7 | 1 | 2 | 1 | 6 | 188 | ||||||||||||||
| 1966 | 1 | 4 | 36 | 2 | 2 | 56 | ||||||||||||||||||||
| 1967 | 1 | 7 | 3 | 1 | 3 | 3 | 10 | 3 | 53 | |||||||||||||||||
| 1968 | 8 | 3 | 2 | 16 | 5 | 57 | ||||||||||||||||||||
| 1969 | 1 | 2 | 30 | 1 | 2 | 2 | 3 | 2 | 12 | 153 | 4 | 2 | 10 | 1 | 445 | |||||||||||
| 1970 | 1 | 3 | 17 | 2 | 55 | 1 | 131 | |||||||||||||||||||
| 1971 | 3 | 2 | 17 | 23 | 1 | 2 | 1 | 68 | ||||||||||||||||||
| 1972 | 2 | 5 | 21 | 2 | 7 | 51 | 237 | 1 | 24 | 20 | 4 | 125 | 1 | 555 | ||||||||||||
| 1973 | 9 | 2 | 16 | 1 | 10 | 7 | 3 | 11 | 27 | 5 | 3 | 3 | 4 | 178 | ||||||||||||
| 1974 | 3 | 2 | 1 | 1 | 1 | 9 | 1 | 2 | 22 | 5 | 9 | 111 | ||||||||||||||
| 1975 | 6 | 6 | 4 | 5 | 2 | 4 | 1 | 5 | 13 | 2 | 3 | 41 | 127 | |||||||||||||
| 1976 | 2 | 3 | 4 | 1 | 3 | 1 | 2 | 1 | 9 | 21 | 1 | 2 | 193 | |||||||||||||
| 1977 | 6 | 11 | 1 | 5 | 78 | 11 | 5 | 4 | 1 | 2 | 4 | 210 | ||||||||||||||
| 1978 | 7 | 1 | 3 | 2 | 1 | 40 | 1 | 2 | 1 | 1 | 3 | 143 | ||||||||||||||
| 1979 | 3 | 5 | 6 | 1 | 3 | 2 | 28 | 8 | 2 | 1 | 9 | 121 | ||||||||||||||
| 1980 | 6 | 3 | 2 | 2 | 9 | 3 | 6 | 1 | 2 | 1 | 2 | 62 | ||||||||||||||
| 1981 | 2 | 4 | 4 | 3 | 36 | 1 | 1 | 84 | ||||||||||||||||||
| 1982 | 1 | 3 | 10 | 1 | 1 | 1 | 1 | 9 | 8 | 7 | 2 | 2 | 131 | |||||||||||||
| 1983 | 4 | 1 | 1 | 4 | 2 | 3 | 5 | 19 | 1 | 5 | 1 | 97 | ||||||||||||||
| 1984 | 6 | 4 | 5 | 15 | 5 | 2 | 3 | 7 | 5 | 2 | 1 | 83 | ||||||||||||||
| 1985 | 8 | 3 | 16 | 19 | 38 | 12 | 52 | 166 | ||||||||||||||||||
| 1986 | 2 | 4 | 1 | 2 | 9 | 4 | 1 | 18 | 1 | 3 | 3 | 1 | 1 | 1 | 2 | 80 | ||||||||||
| 1987 | 11 | 3 | 1 | 1 | 1 | 3 | 17 | 1 | 3 | 3 | 9 | 71 | ||||||||||||||
| 1988 | 3 | 7 | 5 | 31 | ||||||||||||||||||||||
| 1989 | 2 | 4 | 6 | 4 | 1 | 1 | 12 | 17 | 6 | 4 | 1 | 85 | ||||||||||||||
| 1990 | 2 | 1 | 32 | 1 | 1 | 9 | 5 | 14 | 1 | 2 | 7 | 2 | 142 | |||||||||||||
| 1991 | 4 | 1 | 1 | 1 | 1 | 2 | 16 | 3 | 3 | 7 | 3 | 61 | ||||||||||||||
| 1992 | 2 | 2 | 3 | 2 | 3 | 4 | 2 | 39 | ||||||||||||||||||
| 1993 | 8 | 2 | 1 | 5 | 5 | 6 | 1 | 1 | 1 | 1 | 103 | |||||||||||||||
| 1994 | 1 | 2 | 1 | 5 | 1 | 3 | 28 | 5 | 2 | 3 | 89 | |||||||||||||||
| 1995 | 9 | 5 | 2 | 1 | 3 | 26 | 1 | 5 | 1 | 1 | 1 | 79 | ||||||||||||||
| 1996 | 2 | 5 | 12 | 14 | 2 | 3 | 5 | 12 | 28 | 2 | 7 | 1 | 2 | 10 | 12 | 19 | 172 | |||||||||
| 1997 | 2 | 3 | 2 | 5 | 2 | 4 | 5 | 23 | 1 | 6 | 1 | 135 | ||||||||||||||
| 1998 | 3 | 9 | 2 | 2 | 1 | 10 | 45 | 2 | 1 | 2 | 3 | 8 | 150 | |||||||||||||
| 1999 | 6 | 2 | 22 | 2 | 2 | 6 | 2 | 2 | 1 | 4 | 1 | 72 | ||||||||||||||
| 2000 | 1 | 2 | 4 | 1 | 1 | 9 | 1 | 4 | 1 | 43 | ||||||||||||||||
| 2001 | 3 | 1 | 1 | 1 | 31 | 1 | 1 | 1 | 5 | 3 | 72 | |||||||||||||||
| 2002 | ||||||||||||||||||||||||||
| 2003 | ||||||||||||||||||||||||||
| 2004 | ||||||||||||||||||||||||||
| 2005 | ||||||||||||||||||||||||||
| 2006 | ||||||||||||||||||||||||||
| 2007 | ||||||||||||||||||||||||||
| 2008 | ||||||||||||||||||||||||||
| 2009 | ||||||||||||||||||||||||||
| 2010 | ||||||||||||||||||||||||||
| Totals | 68 | 59 | 125 | 122 | 19 | 131 | 98 | 66 | 228 | 17 | 47 | 249 | 115 | 736 | 20 | 24 | 256 | 29 | 270 | 15 | 15 | 3 | 29 | 384 | 5 | 5180 |
thankyou
eden
fifty characters min blablablablablablabla